- Hong Kong
- /
- Healthcare Services
- /
- SEHK:2289
Charmacy Pharmaceutical Co., Ltd. (HKG:2289) Stock's 26% Dive Might Signal An Opportunity But It Requires Some Scrutiny


Unfortunately for some shareholders, the Charmacy Pharmaceutical Co., Ltd. (HKG:2289) share price has dived 26% in the last thirty days, prolonging recent pain. Looking at the bigger picture, even after this poor month the stock is up 32% in the last year.
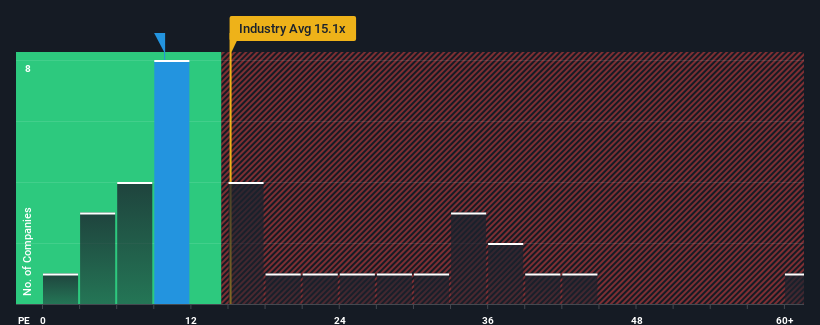
In spite of the heavy fall in price, there still wouldn't be many who think Charmacy Pharmaceutical's price-to-earnings (or "P/E") ratio of 9.8x is worth a mention when the median P/E in Hong Kong is similar at about 9x. Although, it's not wise to simply ignore the P/E without explanation as investors may be disregarding a distinct opportunity or a costly mistake.
Recent times have been quite advantageous for Charmacy Pharmaceutical as its earnings have been rising very briskly. The P/E is probably moderate because investors think this strong earnings growth might not be enough to outperform the broader market in the near future. If you like the company, you'd be hoping this isn't the case so that you could potentially pick up some stock while it's not quite in favour.
Check out our latest analysis for Charmacy Pharmaceutical
Does Growth Match The P/E?
Charmacy Pharmaceutical's P/E ratio would be typical for a company that's only expected to deliver moderate growth, and importantly, perform in line with the market.
Retrospectively, the last year delivered an exceptional 439% gain to the company's bottom line. The latest three year period has also seen an excellent 235% overall rise in EPS, aided by its short-term performance. So we can start by confirming that the company has done a great job of growing earnings over that time.
Weighing that recent medium-term earnings trajectory against the broader market's one-year forecast for expansion of 22% shows it's noticeably more attractive on an annualised basis.
With this information, we find it interesting that Charmacy Pharmaceutical is trading at a fairly similar P/E to the market. It may be that most investors are not convinced the company can maintain its recent growth rates.
The Key Takeaway
Charmacy Pharmaceutical's plummeting stock price has brought its P/E right back to the rest of the market. We'd say the price-to-earnings ratio's power isn't primarily as a valuation instrument but rather to gauge current investor sentiment and future expectations.
Our examination of Charmacy Pharmaceutical revealed its three-year earnings trends aren't contributing to its P/E as much as we would have predicted, given they look better than current market expectations. There could be some unobserved threats to earnings preventing the P/E ratio from matching this positive performance. It appears some are indeed anticipating earnings instability, because the persistence of these recent medium-term conditions would normally provide a boost to the share price.
It is also worth noting that we have found 2 warning signs for Charmacy Pharmaceutical (1 can't be ignored!) that you need to take into consideration.
Of course, you might also be able to find a better stock than Charmacy Pharmaceutical. So you may wish to see this free collection of other companies that have reasonable P/E ratios and have grown earnings strongly.
If you're looking to trade Charmacy Pharmaceutical, open an account with the lowest-cost platform trusted by professionals, Interactive Brokers.
With clients in over 200 countries and territories, and access to 160 markets, IBKR lets you trade stocks, options, futures, forex, bonds and funds from a single integrated account.
Enjoy no hidden fees, no account minimums, and FX conversion rates as low as 0.03%, far better than what most brokers offer.
Sponsored ContentNew: AI Stock Screener & Alerts
Our new AI Stock Screener scans the market every day to uncover opportunities.
• Dividend Powerhouses (3%+ Yield)
• Undervalued Small Caps with Insider Buying
• High growth Tech and AI Companies
Or build your own from over 50 metrics.
Have feedback on this article? Concerned about the content? Get in touch with us directly. Alternatively, email editorial-team (at) simplywallst.com.
This article by Simply Wall St is general in nature. We provide commentary based on historical data and analyst forecasts only using an unbiased methodology and our articles are not intended to be financial advice. It does not constitute a recommendation to buy or sell any stock, and does not take account of your objectives, or your financial situation. We aim to bring you long-term focused analysis driven by fundamental data. Note that our analysis may not factor in the latest price-sensitive company announcements or qualitative material. Simply Wall St has no position in any stocks mentioned.
About SEHK:2289
Charmacy Pharmaceutical
Engages in the pharmaceutical distribution business in the People’s Republic of China.
Proven track record and fair value.
Market Insights

Community Narratives


