- Hong Kong
- /
- Healthcare Services
- /
- SEHK:2279
Yonghe Medical Group Co., Ltd.'s (HKG:2279) Shares Leap 60% Yet They're Still Not Telling The Full Story

Yonghe Medical Group Co., Ltd. (HKG:2279) shareholders would be excited to see that the share price has had a great month, posting a 60% gain and recovering from prior weakness. Still, the 30-day jump doesn't change the fact that longer term shareholders have seen their stock decimated by the 72% share price drop in the last twelve months.
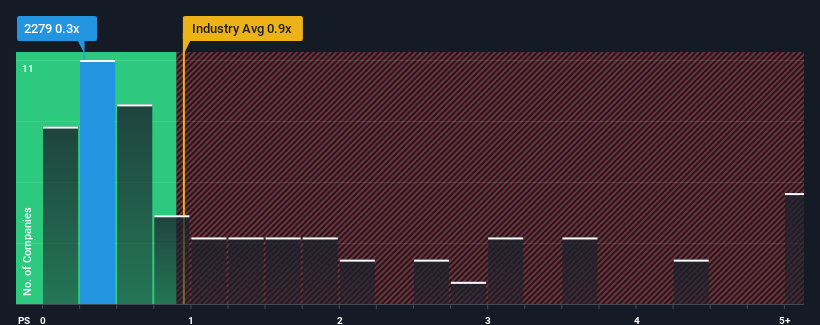
Even after such a large jump in price, Yonghe Medical Group may still be sending buy signals at present with its price-to-sales (or "P/S") ratio of 0.3x, considering almost half of all companies in the Healthcare industry in Hong Kong have P/S ratios greater than 0.9x and even P/S higher than 3x aren't out of the ordinary. Although, it's not wise to just take the P/S at face value as there may be an explanation why it's limited.
See our latest analysis for Yonghe Medical Group
What Does Yonghe Medical Group's Recent Performance Look Like?
Yonghe Medical Group certainly has been doing a good job lately as it's been growing revenue more than most other companies. It might be that many expect the strong revenue performance to degrade substantially, which has repressed the share price, and thus the P/S ratio. If the company manages to stay the course, then investors should be rewarded with a share price that matches its revenue figures.
Want the full picture on analyst estimates for the company? Then our free report on Yonghe Medical Group will help you uncover what's on the horizon.Is There Any Revenue Growth Forecasted For Yonghe Medical Group?
There's an inherent assumption that a company should underperform the industry for P/S ratios like Yonghe Medical Group's to be considered reasonable.
Taking a look back first, we see that the company grew revenue by an impressive 24% last year. However, this wasn't enough as the latest three year period has seen the company endure a nasty 12% drop in revenue in aggregate. Therefore, it's fair to say the revenue growth recently has been undesirable for the company.
Turning to the outlook, the next year should generate growth of 28% as estimated by the only analyst watching the company. That's shaping up to be materially higher than the 13% growth forecast for the broader industry.
In light of this, it's peculiar that Yonghe Medical Group's P/S sits below the majority of other companies. Apparently some shareholders are doubtful of the forecasts and have been accepting significantly lower selling prices.
The Final Word
Yonghe Medical Group's stock price has surged recently, but its but its P/S still remains modest. While the price-to-sales ratio shouldn't be the defining factor in whether you buy a stock or not, it's quite a capable barometer of revenue expectations.
A look at Yonghe Medical Group's revenues reveals that, despite glowing future growth forecasts, its P/S is much lower than we'd expect. When we see strong growth forecasts like this, we can only assume potential risks are what might be placing significant pressure on the P/S ratio. It appears the market could be anticipating revenue instability, because these conditions should normally provide a boost to the share price.
There are also other vital risk factors to consider before investing and we've discovered 2 warning signs for Yonghe Medical Group that you should be aware of.
Of course, profitable companies with a history of great earnings growth are generally safer bets. So you may wish to see this free collection of other companies that have reasonable P/E ratios and have grown earnings strongly.
The New Payments ETF Is Live on NASDAQ:
Money is moving to real-time rails, and a newly listed ETF now gives investors direct exposure. Fast settlement. Institutional custody. Simple access.
Explore how this launch could reshape portfolios
Sponsored ContentNew: Manage All Your Stock Portfolios in One Place
We've created the ultimate portfolio companion for stock investors, and it's free.
• Connect an unlimited number of Portfolios and see your total in one currency
• Be alerted to new Warning Signs or Risks via email or mobile
• Track the Fair Value of your stocks
Have feedback on this article? Concerned about the content? Get in touch with us directly. Alternatively, email editorial-team (at) simplywallst.com.
This article by Simply Wall St is general in nature. We provide commentary based on historical data and analyst forecasts only using an unbiased methodology and our articles are not intended to be financial advice. It does not constitute a recommendation to buy or sell any stock, and does not take account of your objectives, or your financial situation. We aim to bring you long-term focused analysis driven by fundamental data. Note that our analysis may not factor in the latest price-sensitive company announcements or qualitative material. Simply Wall St has no position in any stocks mentioned.
About SEHK:2279
Flawless balance sheet and undervalued.
Market Insights

Weekly Picks

THE KINGDOM OF BROWN GOODS: WHY MGPI IS BEING CRUSHED BY INVENTORY & PRIMED FOR RESURRECTION


Why Vertical Aerospace (NYSE: EVTL) is Worth Possibly Over 13x its Current Price


The Quiet Giant That Became AI’s Power Grid
Recently Updated Narratives


A tech powerhouse quietly powering the world’s AI infrastructure.


Keppel DC REIT (SGX: AJBU) is a resilient gem in the data center space.
Why Vertical Aerospace (NYSE: EVTL) is Worth Possibly Over 13x its Current Price
Popular Narratives

MicroVision will explode future revenue by 380.37% with a vision towards success


Crazy Undervalued 42 Baggers Silver Play (Active & Running Mine)


