
Advertisement
- Hong Kong
- /
- Medical Equipment
- /
- SEHK:1858
Beijing Chunlizhengda Medical Instruments Co., Ltd.'s (HKG:1858) P/E Is Still On The Mark Following 34% Share Price Bounce

Despite an already strong run, Beijing Chunlizhengda Medical Instruments Co., Ltd. (HKG:1858) shares have been powering on, with a gain of 34% in the last thirty days. The annual gain comes to 105% following the latest surge, making investors sit up and take notice.
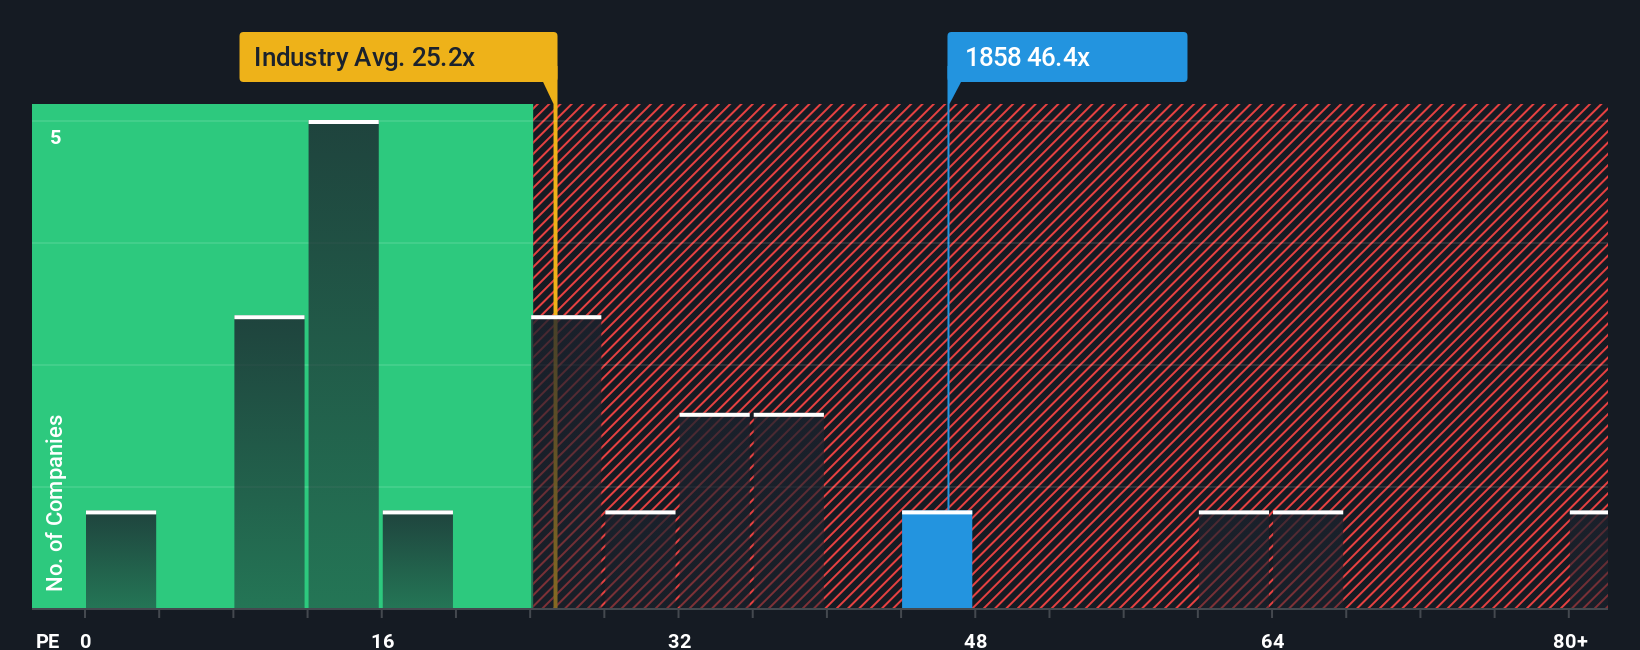
Following the firm bounce in price, given close to half the companies in Hong Kong have price-to-earnings ratios (or "P/E's") below 12x, you may consider Beijing Chunlizhengda Medical Instruments as a stock to avoid entirely with its 46.4x P/E ratio. However, the P/E might be quite high for a reason and it requires further investigation to determine if it's justified.
Beijing Chunlizhengda Medical Instruments hasn't been tracking well recently as its declining earnings compare poorly to other companies, which have seen some growth on average. One possibility is that the P/E is high because investors think this poor earnings performance will turn the corner. If not, then existing shareholders may be extremely nervous about the viability of the share price.
Check out our latest analysis for Beijing Chunlizhengda Medical Instruments
Is There Enough Growth For Beijing Chunlizhengda Medical Instruments?
The only time you'd be truly comfortable seeing a P/E as steep as Beijing Chunlizhengda Medical Instruments' is when the company's growth is on track to outshine the market decidedly.
Retrospectively, the last year delivered a frustrating 52% decrease to the company's bottom line. The last three years don't look nice either as the company has shrunk EPS by 63% in aggregate. Accordingly, shareholders would have felt downbeat about the medium-term rates of earnings growth.
Shifting to the future, estimates from the three analysts covering the company suggest earnings should grow by 28% per year over the next three years. That's shaping up to be materially higher than the 15% per year growth forecast for the broader market.
With this information, we can see why Beijing Chunlizhengda Medical Instruments is trading at such a high P/E compared to the market. Apparently shareholders aren't keen to offload something that is potentially eyeing a more prosperous future.
What We Can Learn From Beijing Chunlizhengda Medical Instruments' P/E?
Beijing Chunlizhengda Medical Instruments' P/E is flying high just like its stock has during the last month. We'd say the price-to-earnings ratio's power isn't primarily as a valuation instrument but rather to gauge current investor sentiment and future expectations.
We've established that Beijing Chunlizhengda Medical Instruments maintains its high P/E on the strength of its forecast growth being higher than the wider market, as expected. At this stage investors feel the potential for a deterioration in earnings isn't great enough to justify a lower P/E ratio. It's hard to see the share price falling strongly in the near future under these circumstances.
You always need to take note of risks, for example - Beijing Chunlizhengda Medical Instruments has 1 warning sign we think you should be aware of.
If these risks are making you reconsider your opinion on Beijing Chunlizhengda Medical Instruments, explore our interactive list of high quality stocks to get an idea of what else is out there.
Valuation is complex, but we're here to simplify it.
Discover if Beijing Chunlizhengda Medical Instruments might be undervalued or overvalued with our detailed analysis, featuring fair value estimates, potential risks, dividends, insider trades, and its financial condition.
Access Free AnalysisHave feedback on this article? Concerned about the content? Get in touch with us directly. Alternatively, email editorial-team (at) simplywallst.com.
This article by Simply Wall St is general in nature. We provide commentary based on historical data and analyst forecasts only using an unbiased methodology and our articles are not intended to be financial advice. It does not constitute a recommendation to buy or sell any stock, and does not take account of your objectives, or your financial situation. We aim to bring you long-term focused analysis driven by fundamental data. Note that our analysis may not factor in the latest price-sensitive company announcements or qualitative material. Simply Wall St has no position in any stocks mentioned.
About SEHK:1858
Beijing Chunlizhengda Medical Instruments
Beijing Chunlizhengda Medical Instruments Co., Ltd.
Flawless balance sheet with reasonable growth potential.
Similar Companies
Market Insights


Advertisement
Community Narratives
America Wants Homegrown Drones — Draganfly Is Ready to Deliver
Fair Value US$9.21|33.9% undervalued
JO
Community Contributor
Cheesecake Factory offers an enticing opportunity for long-term growth by leveraging new concepts
Fair Value US$73.83|26.5% undervalued
ZW
Community Contributor
Coca-Cola’s Intrinsic Value Set to Rise with Fed Rate Cut
Fair Value US$67.50|2.3% undervalued
AL
Community Contributor
Fully Permitted Gold Mine with 50 Baggers Potential 
Fair Value CA$41.00|98.0% undervalued
RO
Community Contributor