Calculating The Intrinsic Value Of Tsingtao Brewery Company Limited (HKG:168)

Today we will run through one way of estimating the intrinsic value of Tsingtao Brewery Company Limited (HKG:168) by estimating the company's future cash flows and discounting them to their present value. We will take advantage of the Discounted Cash Flow (DCF) model for this purpose. Believe it or not, it's not too difficult to follow, as you'll see from our example!
Companies can be valued in a lot of ways, so we would point out that a DCF is not perfect for every situation. If you want to learn more about discounted cash flow, the rationale behind this calculation can be read in detail in the Simply Wall St analysis model.
Check out our latest analysis for Tsingtao Brewery
The model
We use what is known as a 2-stage model, which simply means we have two different periods of growth rates for the company's cash flows. Generally the first stage is higher growth, and the second stage is a lower growth phase. To begin with, we have to get estimates of the next ten years of cash flows. Where possible we use analyst estimates, but when these aren't available we extrapolate the previous free cash flow (FCF) from the last estimate or reported value. We assume companies with shrinking free cash flow will slow their rate of shrinkage, and that companies with growing free cash flow will see their growth rate slow, over this period. We do this to reflect that growth tends to slow more in the early years than it does in later years.
A DCF is all about the idea that a dollar in the future is less valuable than a dollar today, so we discount the value of these future cash flows to their estimated value in today's dollars:
10-year free cash flow (FCF) forecast
| 2022 | 2023 | 2024 | 2025 | 2026 | 2027 | 2028 | 2029 | 2030 | 2031 | |
| Levered FCF (CN¥, Millions) | CN¥2.64b | CN¥3.77b | CN¥3.30b | CN¥3.13b | CN¥3.04b | CN¥2.99b | CN¥2.96b | CN¥2.96b | CN¥2.97b | CN¥2.99b |
| Growth Rate Estimate Source | Analyst x4 | Analyst x7 | Analyst x4 | Est @ -5.02% | Est @ -3.07% | Est @ -1.7% | Est @ -0.75% | Est @ -0.08% | Est @ 0.39% | Est @ 0.72% |
| Present Value (CN¥, Millions) Discounted @ 5.4% | CN¥2.5k | CN¥3.4k | CN¥2.8k | CN¥2.5k | CN¥2.3k | CN¥2.2k | CN¥2.0k | CN¥1.9k | CN¥1.8k | CN¥1.8k |
("Est" = FCF growth rate estimated by Simply Wall St)
Present Value of 10-year Cash Flow (PVCF) = CN¥23b
The second stage is also known as Terminal Value, this is the business's cash flow after the first stage. For a number of reasons a very conservative growth rate is used that cannot exceed that of a country's GDP growth. In this case we have used the 5-year average of the 10-year government bond yield (1.5%) to estimate future growth. In the same way as with the 10-year 'growth' period, we discount future cash flows to today's value, using a cost of equity of 5.4%.
Terminal Value (TV)= FCF2031 × (1 + g) ÷ (r – g) = CN¥3.0b× (1 + 1.5%) ÷ (5.4%– 1.5%) = CN¥77b
Present Value of Terminal Value (PVTV)= TV / (1 + r)10= CN¥77b÷ ( 1 + 5.4%)10= CN¥45b
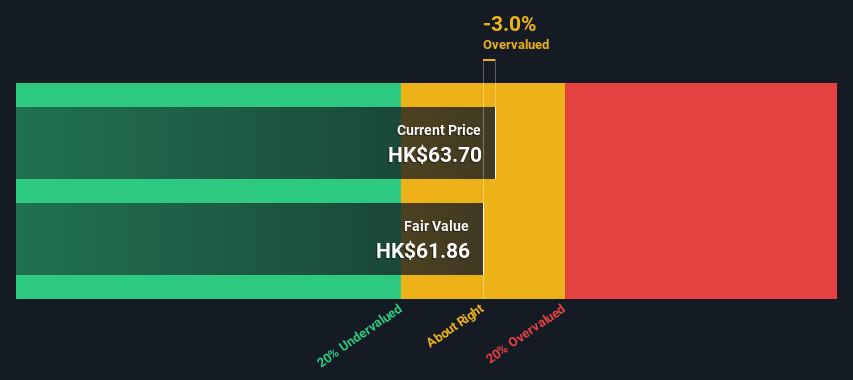
The total value, or equity value, is then the sum of the present value of the future cash flows, which in this case is CN¥69b. To get the intrinsic value per share, we divide this by the total number of shares outstanding. Compared to the current share price of HK$63.7, the company appears around fair value at the time of writing. Remember though, that this is just an approximate valuation, and like any complex formula - garbage in, garbage out.
The assumptions
The calculation above is very dependent on two assumptions. The first is the discount rate and the other is the cash flows. Part of investing is coming up with your own evaluation of a company's future performance, so try the calculation yourself and check your own assumptions. The DCF also does not consider the possible cyclicality of an industry, or a company's future capital requirements, so it does not give a full picture of a company's potential performance. Given that we are looking at Tsingtao Brewery as potential shareholders, the cost of equity is used as the discount rate, rather than the cost of capital (or weighted average cost of capital, WACC) which accounts for debt. In this calculation we've used 5.4%, which is based on a levered beta of 0.800. Beta is a measure of a stock's volatility, compared to the market as a whole. We get our beta from the industry average beta of globally comparable companies, with an imposed limit between 0.8 and 2.0, which is a reasonable range for a stable business.
Looking Ahead:
Whilst important, the DCF calculation ideally won't be the sole piece of analysis you scrutinize for a company. DCF models are not the be-all and end-all of investment valuation. Rather it should be seen as a guide to "what assumptions need to be true for this stock to be under/overvalued?" If a company grows at a different rate, or if its cost of equity or risk free rate changes sharply, the output can look very different. For Tsingtao Brewery, there are three essential items you should look at:
- Risks: For example, we've discovered 1 warning sign for Tsingtao Brewery that you should be aware of before investing here.
- Future Earnings: How does 168's growth rate compare to its peers and the wider market? Dig deeper into the analyst consensus number for the upcoming years by interacting with our free analyst growth expectation chart.
- Other High Quality Alternatives: Do you like a good all-rounder? Explore our interactive list of high quality stocks to get an idea of what else is out there you may be missing!
PS. The Simply Wall St app conducts a discounted cash flow valuation for every stock on the SEHK every day. If you want to find the calculation for other stocks just search here.
Valuation is complex, but we're here to simplify it.
Discover if Tsingtao Brewery might be undervalued or overvalued with our detailed analysis, featuring fair value estimates, potential risks, dividends, insider trades, and its financial condition.
Access Free AnalysisHave feedback on this article? Concerned about the content? Get in touch with us directly. Alternatively, email editorial-team (at) simplywallst.com.
This article by Simply Wall St is general in nature. We provide commentary based on historical data and analyst forecasts only using an unbiased methodology and our articles are not intended to be financial advice. It does not constitute a recommendation to buy or sell any stock, and does not take account of your objectives, or your financial situation. We aim to bring you long-term focused analysis driven by fundamental data. Note that our analysis may not factor in the latest price-sensitive company announcements or qualitative material. Simply Wall St has no position in any stocks mentioned.
About SEHK:168
Tsingtao Brewery
Engages in the production, distribution, wholesale, and retail sale of beer products in Mainland China, Hong Kong, Macau, and internationally.
Flawless balance sheet, undervalued and pays a dividend.

