
Advertisement
- Hong Kong
- /
- Oil and Gas
- /
- SEHK:883
Investors in CNOOC (HKG:883) have seen stellar returns of 240% over the past three years
CNOOC Limited (HKG:883) shareholders might be concerned after seeing the share price drop 10% in the last month. In contrast, the return over three years has been impressive. In three years the stock price has launched 141% higher: a great result. To some, the recent share price pullback wouldn't be surprising after such a good run. The fundamental business performance will ultimately dictate whether the top is in, or if this is a stellar buying opportunity.
With that in mind, it's worth seeing if the company's underlying fundamentals have been the driver of long term performance, or if there are some discrepancies.
View our latest analysis for CNOOC
To quote Buffett, 'Ships will sail around the world but the Flat Earth Society will flourish. There will continue to be wide discrepancies between price and value in the marketplace...' One imperfect but simple way to consider how the market perception of a company has shifted is to compare the change in the earnings per share (EPS) with the share price movement.
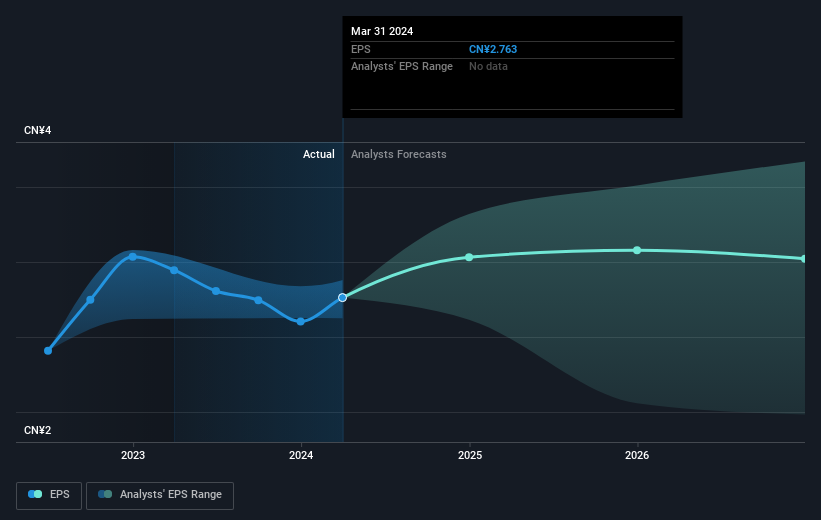
CNOOC was able to grow its EPS at 53% per year over three years, sending the share price higher. The average annual share price increase of 34% is actually lower than the EPS growth. So it seems investors have become more cautious about the company, over time. We'd venture the lowish P/E ratio of 6.62 also reflects the negative sentiment around the stock.
You can see below how EPS has changed over time (discover the exact values by clicking on the image).
It's probably worth noting that the CEO is paid less than the median at similar sized companies. It's always worth keeping an eye on CEO pay, but a more important question is whether the company will grow earnings throughout the years. Dive deeper into the earnings by checking this interactive graph of CNOOC's earnings, revenue and cash flow.
What About Dividends?
As well as measuring the share price return, investors should also consider the total shareholder return (TSR). Whereas the share price return only reflects the change in the share price, the TSR includes the value of dividends (assuming they were reinvested) and the benefit of any discounted capital raising or spin-off. Arguably, the TSR gives a more comprehensive picture of the return generated by a stock. In the case of CNOOC, it has a TSR of 240% for the last 3 years. That exceeds its share price return that we previously mentioned. The dividends paid by the company have thusly boosted the total shareholder return.
A Different Perspective
We're pleased to report that CNOOC shareholders have received a total shareholder return of 64% over one year. Of course, that includes the dividend. That gain is better than the annual TSR over five years, which is 23%. Therefore it seems like sentiment around the company has been positive lately. Given the share price momentum remains strong, it might be worth taking a closer look at the stock, lest you miss an opportunity. It's always interesting to track share price performance over the longer term. But to understand CNOOC better, we need to consider many other factors. Case in point: We've spotted 2 warning signs for CNOOC you should be aware of, and 1 of them is a bit concerning.
Of course CNOOC may not be the best stock to buy. So you may wish to see this free collection of growth stocks.
Please note, the market returns quoted in this article reflect the market weighted average returns of stocks that currently trade on Hong Kong exchanges.
New: AI Stock Screener & Alerts
Our new AI Stock Screener scans the market every day to uncover opportunities.
• Dividend Powerhouses (3%+ Yield)
• Undervalued Small Caps with Insider Buying
• High growth Tech and AI Companies
Or build your own from over 50 metrics.
Have feedback on this article? Concerned about the content? Get in touch with us directly. Alternatively, email editorial-team (at) simplywallst.com.
This article by Simply Wall St is general in nature. We provide commentary based on historical data and analyst forecasts only using an unbiased methodology and our articles are not intended to be financial advice. It does not constitute a recommendation to buy or sell any stock, and does not take account of your objectives, or your financial situation. We aim to bring you long-term focused analysis driven by fundamental data. Note that our analysis may not factor in the latest price-sensitive company announcements or qualitative material. Simply Wall St has no position in any stocks mentioned.
About SEHK:883
CNOOC
An investment holding company, engages in the exploration, development, production, and sale of crude oil and natural gas in the People’s Republic of China, Canada, and internationally.
Flawless balance sheet, undervalued and pays a dividend.
Similar Companies
Market Insights

Advertisement
Community Narratives
Quality at a Premium. A time to watch, not to buy?
Fair Value US$154.56|29.3% undervalued
DA
Community Contributor
GRAB: The Super-App at the Heart of Southeast Asia’s Digital Boom
Fair Value US$6.60|7.0% undervalued
BL
Community Contributor
Verve Group to Surge with 51.61% Revenue Growth
Fair Value €6.00|65.0% undervalued
ME
Community Contributor