
Advertisement
- Hong Kong
- /
- Oil and Gas
- /
- SEHK:8270
Not Many Are Piling Into China CBM Group Company Limited (HKG:8270) Stock Yet As It Plummets 30%
China CBM Group Company Limited (HKG:8270) shareholders won't be pleased to see that the share price has had a very rough month, dropping 30% and undoing the prior period's positive performance. For any long-term shareholders, the last month ends a year to forget by locking in a 57% share price decline.
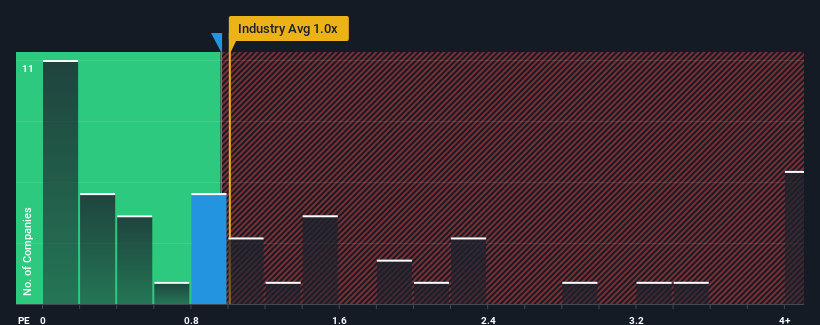
Even after such a large drop in price, it's still not a stretch to say that China CBM Group's price-to-sales (or "P/S") ratio of 1x right now seems quite "middle-of-the-road" compared to the Oil and Gas industry in Hong Kong, seeing as it matches the P/S ratio of the wider industry. However, investors might be overlooking a clear opportunity or potential setback if there is no rational basis for the P/S.
View our latest analysis for China CBM Group
How China CBM Group Has Been Performing
For example, consider that China CBM Group's financial performance has been poor lately as its revenue has been in decline. One possibility is that the P/S is moderate because investors think the company might still do enough to be in line with the broader industry in the near future. If not, then existing shareholders may be a little nervous about the viability of the share price.
Although there are no analyst estimates available for China CBM Group, take a look at this free data-rich visualisation to see how the company stacks up on earnings, revenue and cash flow.Is There Some Revenue Growth Forecasted For China CBM Group?
There's an inherent assumption that a company should be matching the industry for P/S ratios like China CBM Group's to be considered reasonable.
Retrospectively, the last year delivered a frustrating 21% decrease to the company's top line. However, a few very strong years before that means that it was still able to grow revenue by an impressive 59% in total over the last three years. Although it's been a bumpy ride, it's still fair to say the revenue growth recently has been more than adequate for the company.
Comparing that to the industry, which is only predicted to deliver 0.6% growth in the next 12 months, the company's momentum is stronger based on recent medium-term annualised revenue results.
In light of this, it's curious that China CBM Group's P/S sits in line with the majority of other companies. Apparently some shareholders believe the recent performance is at its limits and have been accepting lower selling prices.
The Key Takeaway
China CBM Group's plummeting stock price has brought its P/S back to a similar region as the rest of the industry. It's argued the price-to-sales ratio is an inferior measure of value within certain industries, but it can be a powerful business sentiment indicator.
To our surprise, China CBM Group revealed its three-year revenue trends aren't contributing to its P/S as much as we would have predicted, given they look better than current industry expectations. There could be some unobserved threats to revenue preventing the P/S ratio from matching this positive performance. It appears some are indeed anticipating revenue instability, because the persistence of these recent medium-term conditions would normally provide a boost to the share price.
Having said that, be aware China CBM Group is showing 5 warning signs in our investment analysis, you should know about.
It's important to make sure you look for a great company, not just the first idea you come across. So if growing profitability aligns with your idea of a great company, take a peek at this free list of interesting companies with strong recent earnings growth (and a low P/E).
New: AI Stock Screener & Alerts
Our new AI Stock Screener scans the market every day to uncover opportunities.
• Dividend Powerhouses (3%+ Yield)
• Undervalued Small Caps with Insider Buying
• High growth Tech and AI Companies
Or build your own from over 50 metrics.
Have feedback on this article? Concerned about the content? Get in touch with us directly. Alternatively, email editorial-team (at) simplywallst.com.
This article by Simply Wall St is general in nature. We provide commentary based on historical data and analyst forecasts only using an unbiased methodology and our articles are not intended to be financial advice. It does not constitute a recommendation to buy or sell any stock, and does not take account of your objectives, or your financial situation. We aim to bring you long-term focused analysis driven by fundamental data. Note that our analysis may not factor in the latest price-sensitive company announcements or qualitative material. Simply Wall St has no position in any stocks mentioned.
About SEHK:8270
China CBM Group
An investment holding company, engages in the exploitation, liquefaction production, and sale of natural gas and coalbed gas in the People’s Republic of China.
Mediocre balance sheet and slightly overvalued.
Market Insights

Advertisement
Community Narratives
The "Molecular Pencil": Why Beam's Technology is Built to Win
Fair Value US$65.01|65.4% undervalued
DA
Community Contributor
The silent giant behind virtually every advanced chip powering AI, smartphones, and modern infrastructure.
Fair Value US$310.00|6.1% undervalued
OS
Community Contributor
ADP Stock: Solid Fundamentals, But AI Investments Test Its Margin Resilience
Fair Value US$387.77|34.2% undervalued
YI
Community Contributor
MINISO's fair value is projected at 26.69 with an anticipated PE ratio shift of 20x
Fair Value US$24.03|9.6% undervalued
BE
Community Contributor