- Hong Kong
- /
- Oil and Gas
- /
- SEHK:386
Would Shareholders Who Purchased China Petroleum & Chemical's (HKG:386) Stock Three Years Be Happy With The Share price Today?

China Petroleum & Chemical Corporation (HKG:386) shareholders should be happy to see the share price up 23% in the last quarter. But that cannot eclipse the less-than-impressive returns over the last three years. Truth be told the share price declined 32% in three years and that return, Dear Reader, falls short of what you could have got from passive investing with an index fund.
View our latest analysis for China Petroleum & Chemical
To quote Buffett, 'Ships will sail around the world but the Flat Earth Society will flourish. There will continue to be wide discrepancies between price and value in the marketplace...' One way to examine how market sentiment has changed over time is to look at the interaction between a company's share price and its earnings per share (EPS).
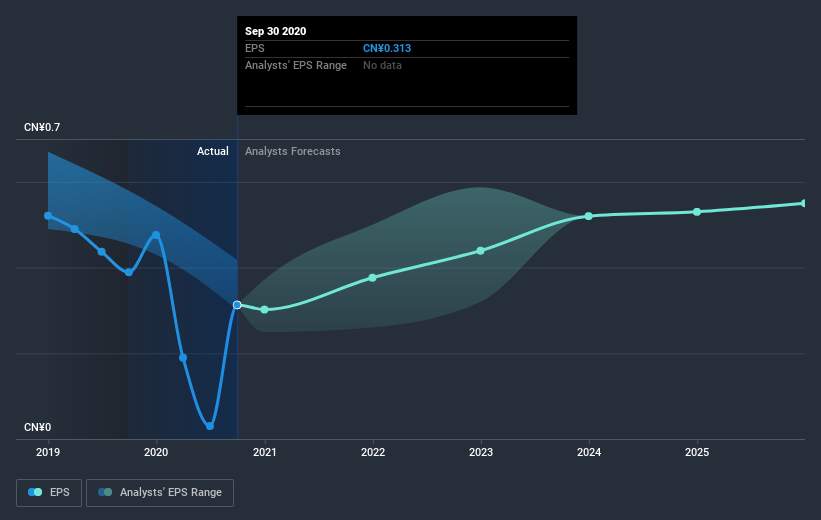
China Petroleum & Chemical saw its EPS decline at a compound rate of 12% per year, over the last three years. The 12% average annual share price decline is remarkably close to the EPS decline. That suggests that the market sentiment around the company hasn't changed much over that time, despite the disappointment. In this case, it seems that the EPS is guiding the share price.
The graphic below depicts how EPS has changed over time (unveil the exact values by clicking on the image).
We're pleased to report that the CEO is remunerated more modestly than most CEOs at similarly capitalized companies. It's always worth keeping an eye on CEO pay, but a more important question is whether the company will grow earnings throughout the years. Dive deeper into the earnings by checking this interactive graph of China Petroleum & Chemical's earnings, revenue and cash flow.
What About Dividends?
It is important to consider the total shareholder return, as well as the share price return, for any given stock. The TSR is a return calculation that accounts for the value of cash dividends (assuming that any dividend received was reinvested) and the calculated value of any discounted capital raisings and spin-offs. So for companies that pay a generous dividend, the TSR is often a lot higher than the share price return. In the case of China Petroleum & Chemical, it has a TSR of -12% for the last 3 years. That exceeds its share price return that we previously mentioned. The dividends paid by the company have thusly boosted the total shareholder return.
A Different Perspective
China Petroleum & Chemical shareholders gained a total return of 21% during the year. Unfortunately this falls short of the market return. On the bright side, that's still a gain, and it's actually better than the average return of 4% over half a decade This could indicate that the company is winning over new investors, as it pursues its strategy. It's always interesting to track share price performance over the longer term. But to understand China Petroleum & Chemical better, we need to consider many other factors. Case in point: We've spotted 1 warning sign for China Petroleum & Chemical you should be aware of.
Of course China Petroleum & Chemical may not be the best stock to buy. So you may wish to see this free collection of growth stocks.
Please note, the market returns quoted in this article reflect the market weighted average returns of stocks that currently trade on HK exchanges.
If you’re looking to trade China Petroleum & Chemical, open an account with the lowest-cost* platform trusted by professionals, Interactive Brokers. Their clients from over 200 countries and territories trade stocks, options, futures, forex, bonds and funds worldwide from a single integrated account. Promoted
New: AI Stock Screener & Alerts
Our new AI Stock Screener scans the market every day to uncover opportunities.
• Dividend Powerhouses (3%+ Yield)
• Undervalued Small Caps with Insider Buying
• High growth Tech and AI Companies
Or build your own from over 50 metrics.
This article by Simply Wall St is general in nature. It does not constitute a recommendation to buy or sell any stock, and does not take account of your objectives, or your financial situation. We aim to bring you long-term focused analysis driven by fundamental data. Note that our analysis may not factor in the latest price-sensitive company announcements or qualitative material. Simply Wall St has no position in any stocks mentioned.
*Interactive Brokers Rated Lowest Cost Broker by StockBrokers.com Annual Online Review 2020
Have feedback on this article? Concerned about the content? Get in touch with us directly. Alternatively, email editorial-team (at) simplywallst.com.
About SEHK:386
China Petroleum & Chemical
An energy and chemical company, engages in the oil and gas and chemical operations in Mainland China, Singapore, and internationally.
Good value with adequate balance sheet and pays a dividend.
Similar Companies
Market Insights

Community Narratives
