
Advertisement
- Hong Kong
- /
- Oil and Gas
- /
- SEHK:386
Is China Petroleum & Chemical Corporation (HKG:386) Worth HK$3.7 Based On Its Intrinsic Value?
Today we will run through one way of estimating the intrinsic value of China Petroleum & Chemical Corporation (HKG:386) by taking the expected future cash flows and discounting them to their present value. Our analysis will employ the Discounted Cash Flow (DCF) model. Before you think you won't be able to understand it, just read on! It's actually much less complex than you'd imagine.
Remember though, that there are many ways to estimate a company's value, and a DCF is just one method. Anyone interested in learning a bit more about intrinsic value should have a read of the Simply Wall St analysis model.
See our latest analysis for China Petroleum & Chemical
The calculation
We're using the 2-stage growth model, which simply means we take in account two stages of company's growth. In the initial period the company may have a higher growth rate and the second stage is usually assumed to have a stable growth rate. In the first stage we need to estimate the cash flows to the business over the next ten years. Where possible we use analyst estimates, but when these aren't available we extrapolate the previous free cash flow (FCF) from the last estimate or reported value. We assume companies with shrinking free cash flow will slow their rate of shrinkage, and that companies with growing free cash flow will see their growth rate slow, over this period. We do this to reflect that growth tends to slow more in the early years than it does in later years.
Generally we assume that a dollar today is more valuable than a dollar in the future, and so the sum of these future cash flows is then discounted to today's value:
10-year free cash flow (FCF) forecast
| 2022 | 2023 | 2024 | 2025 | 2026 | 2027 | 2028 | 2029 | 2030 | 2031 | |
| Levered FCF (CN¥, Millions) | CN¥51.8b | CN¥49.3b | CN¥122.0b | CN¥52.1b | CN¥25.4b | CN¥16.4b | CN¥12.4b | CN¥10.3b | CN¥9.17b | CN¥8.50b |
| Growth Rate Estimate Source | Analyst x3 | Analyst x3 | Analyst x2 | Analyst x1 | Est @ -51.29% | Est @ -35.46% | Est @ -24.38% | Est @ -16.62% | Est @ -11.19% | Est @ -7.39% |
| Present Value (CN¥, Millions) Discounted @ 10% | CN¥47.0k | CN¥40.7k | CN¥91.5k | CN¥35.5k | CN¥15.7k | CN¥9.2k | CN¥6.3k | CN¥4.8k | CN¥3.9k | CN¥3.3k |
("Est" = FCF growth rate estimated by Simply Wall St)
Present Value of 10-year Cash Flow (PVCF) = CN¥258b
After calculating the present value of future cash flows in the initial 10-year period, we need to calculate the Terminal Value, which accounts for all future cash flows beyond the first stage. The Gordon Growth formula is used to calculate Terminal Value at a future annual growth rate equal to the 5-year average of the 10-year government bond yield of 1.5%. We discount the terminal cash flows to today's value at a cost of equity of 10%.
Terminal Value (TV)= FCF2031 × (1 + g) ÷ (r – g) = CN¥8.5b× (1 + 1.5%) ÷ (10%– 1.5%) = CN¥100b
Present Value of Terminal Value (PVTV)= TV / (1 + r)10= CN¥100b÷ ( 1 + 10%)10= CN¥39b
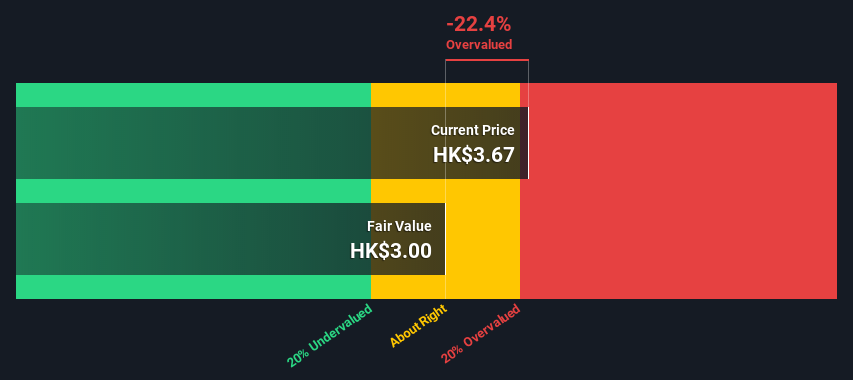
The total value, or equity value, is then the sum of the present value of the future cash flows, which in this case is CN¥296b. In the final step we divide the equity value by the number of shares outstanding. Compared to the current share price of HK$3.7, the company appears slightly overvalued at the time of writing. Remember though, that this is just an approximate valuation, and like any complex formula - garbage in, garbage out.
The assumptions
Now the most important inputs to a discounted cash flow are the discount rate, and of course, the actual cash flows. You don't have to agree with these inputs, I recommend redoing the calculations yourself and playing with them. The DCF also does not consider the possible cyclicality of an industry, or a company's future capital requirements, so it does not give a full picture of a company's potential performance. Given that we are looking at China Petroleum & Chemical as potential shareholders, the cost of equity is used as the discount rate, rather than the cost of capital (or weighted average cost of capital, WACC) which accounts for debt. In this calculation we've used 10%, which is based on a levered beta of 1.727. Beta is a measure of a stock's volatility, compared to the market as a whole. We get our beta from the industry average beta of globally comparable companies, with an imposed limit between 0.8 and 2.0, which is a reasonable range for a stable business.
Next Steps:
Whilst important, the DCF calculation shouldn't be the only metric you look at when researching a company. The DCF model is not a perfect stock valuation tool. Instead the best use for a DCF model is to test certain assumptions and theories to see if they would lead to the company being undervalued or overvalued. For example, changes in the company's cost of equity or the risk free rate can significantly impact the valuation. What is the reason for the share price exceeding the intrinsic value? For China Petroleum & Chemical, we've compiled three relevant factors you should consider:
- Risks: For example, we've discovered 2 warning signs for China Petroleum & Chemical (1 is significant!) that you should be aware of before investing here.
- Future Earnings: How does 386's growth rate compare to its peers and the wider market? Dig deeper into the analyst consensus number for the upcoming years by interacting with our free analyst growth expectation chart.
- Other High Quality Alternatives: Do you like a good all-rounder? Explore our interactive list of high quality stocks to get an idea of what else is out there you may be missing!
PS. The Simply Wall St app conducts a discounted cash flow valuation for every stock on the SEHK every day. If you want to find the calculation for other stocks just search here.
New: AI Stock Screener & Alerts
Our new AI Stock Screener scans the market every day to uncover opportunities.
• Dividend Powerhouses (3%+ Yield)
• Undervalued Small Caps with Insider Buying
• High growth Tech and AI Companies
Or build your own from over 50 metrics.
Have feedback on this article? Concerned about the content? Get in touch with us directly. Alternatively, email editorial-team (at) simplywallst.com.
This article by Simply Wall St is general in nature. We provide commentary based on historical data and analyst forecasts only using an unbiased methodology and our articles are not intended to be financial advice. It does not constitute a recommendation to buy or sell any stock, and does not take account of your objectives, or your financial situation. We aim to bring you long-term focused analysis driven by fundamental data. Note that our analysis may not factor in the latest price-sensitive company announcements or qualitative material. Simply Wall St has no position in any stocks mentioned.
About SEHK:386
China Petroleum & Chemical
An energy and chemical company, engages in the oil and gas and chemical operations in Mainland China, Singapore, and internationally.
Good value with adequate balance sheet and pays a dividend.
Similar Companies
Market Insights


Advertisement
Community Narratives
Nike's Direct-to-Consumer Focus Will Drive Future Growth
Fair Value US$87.90|18.2% undervalued
UN
Community Contributor
Novo Nordisk will dominate GLP-1 market with Ozempic and Wegovy growth
Fair Value US$89.59|12.1% undervalued
BE
Community Contributor
Rheinmetall could get 20-25% of EU-NATO 3%-GDP defence spending
Fair Value €7.57k|82.4% undervalued
NO
Community Contributor