- Hong Kong
- /
- Oil and Gas
- /
- SEHK:353
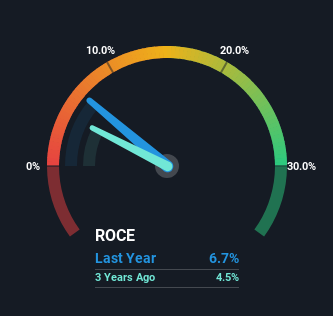
Energy International Investments Holdings' (HKG:353) Returns On Capital Are Heading Higher


What trends should we look for it we want to identify stocks that can multiply in value over the long term? Firstly, we'll want to see a proven return on capital employed (ROCE) that is increasing, and secondly, an expanding base of capital employed. Put simply, these types of businesses are compounding machines, meaning they are continually reinvesting their earnings at ever-higher rates of return. So on that note, Energy International Investments Holdings (HKG:353) looks quite promising in regards to its trends of return on capital.
Understanding Return On Capital Employed (ROCE)
Just to clarify if you're unsure, ROCE is a metric for evaluating how much pre-tax income (in percentage terms) a company earns on the capital invested in its business. To calculate this metric for Energy International Investments Holdings, this is the formula:
Return on Capital Employed = Earnings Before Interest and Tax (EBIT) ÷ (Total Assets - Current Liabilities)
0.067 = HK$119m ÷ (HK$2.0b - HK$219m) (Based on the trailing twelve months to March 2023).
Thus, Energy International Investments Holdings has an ROCE of 6.7%. On its own that's a low return on capital but it's in line with the industry's average returns of 6.8%.
View our latest analysis for Energy International Investments Holdings
While the past is not representative of the future, it can be helpful to know how a company has performed historically, which is why we have this chart above. If you'd like to look at how Energy International Investments Holdings has performed in the past in other metrics, you can view this free graph of past earnings, revenue and cash flow.
The Trend Of ROCE
We're delighted to see that Energy International Investments Holdings is reaping rewards from its investments and is now generating some pre-tax profits. Shareholders would no doubt be pleased with this because the business was loss-making five years ago but is is now generating 6.7% on its capital. In addition to that, Energy International Investments Holdings is employing 77% more capital than previously which is expected of a company that's trying to break into profitability. This can tell us that the company has plenty of reinvestment opportunities that are able to generate higher returns.
In another part of our analysis, we noticed that the company's ratio of current liabilities to total assets decreased to 11%, which broadly means the business is relying less on its suppliers or short-term creditors to fund its operations. This tells us that Energy International Investments Holdings has grown its returns without a reliance on increasing their current liabilities, which we're very happy with.
The Bottom Line
Long story short, we're delighted to see that Energy International Investments Holdings' reinvestment activities have paid off and the company is now profitable. However the stock is down a substantial 71% in the last five years so there could be other areas of the business hurting its prospects. In any case, we believe the economic trends of this company are positive and looking into the stock further could prove rewarding.
One final note, you should learn about the 4 warning signs we've spotted with Energy International Investments Holdings (including 1 which is a bit concerning) .
While Energy International Investments Holdings may not currently earn the highest returns, we've compiled a list of companies that currently earn more than 25% return on equity. Check out this free list here.
If you're looking to trade Energy International Investments Holdings, open an account with the lowest-cost platform trusted by professionals, Interactive Brokers.
With clients in over 200 countries and territories, and access to 160 markets, IBKR lets you trade stocks, options, futures, forex, bonds and funds from a single integrated account.
Enjoy no hidden fees, no account minimums, and FX conversion rates as low as 0.03%, far better than what most brokers offer.
Sponsored ContentValuation is complex, but we're here to simplify it.
Discover if Energy International Investments Holdings might be undervalued or overvalued with our detailed analysis, featuring fair value estimates, potential risks, dividends, insider trades, and its financial condition.
Access Free AnalysisHave feedback on this article? Concerned about the content? Get in touch with us directly. Alternatively, email editorial-team (at) simplywallst.com.
This article by Simply Wall St is general in nature. We provide commentary based on historical data and analyst forecasts only using an unbiased methodology and our articles are not intended to be financial advice. It does not constitute a recommendation to buy or sell any stock, and does not take account of your objectives, or your financial situation. We aim to bring you long-term focused analysis driven by fundamental data. Note that our analysis may not factor in the latest price-sensitive company announcements or qualitative material. Simply Wall St has no position in any stocks mentioned.
About SEHK:353
Energy International Investments Holdings
An investment holding company, engages in the oil production, and oil and liquefied chemical terminal leasing businesses in the People’s Republic of China and Hong Kong.
Solid track record with excellent balance sheet.
Market Insights

Community Narratives


