
Advertisement
- Hong Kong
- /
- Energy Services
- /
- SEHK:1960
Some TBK & Sons Holdings Limited (HKG:1960) Shareholders Look For Exit As Shares Take 45% Pounding
TBK & Sons Holdings Limited (HKG:1960) shareholders that were waiting for something to happen have been dealt a blow with a 45% share price drop in the last month. For any long-term shareholders, the last month ends a year to forget by locking in a 58% share price decline.
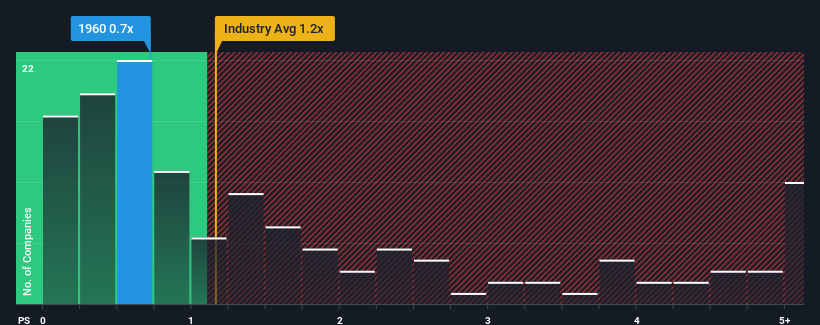
Even after such a large drop in price, it's still not a stretch to say that TBK & Sons Holdings' price-to-sales (or "P/S") ratio of 0.7x right now seems quite "middle-of-the-road" compared to the Energy Services industry in Hong Kong, where the median P/S ratio is around 0.4x. Although, it's not wise to simply ignore the P/S without explanation as investors may be disregarding a distinct opportunity or a costly mistake.
See our latest analysis for TBK & Sons Holdings
What Does TBK & Sons Holdings' Recent Performance Look Like?
For instance, TBK & Sons Holdings' receding revenue in recent times would have to be some food for thought. It might be that many expect the company to put the disappointing revenue performance behind them over the coming period, which has kept the P/S from falling. If you like the company, you'd at least be hoping this is the case so that you could potentially pick up some stock while it's not quite in favour.
Want the full picture on earnings, revenue and cash flow for the company? Then our free report on TBK & Sons Holdings will help you shine a light on its historical performance.How Is TBK & Sons Holdings' Revenue Growth Trending?
TBK & Sons Holdings' P/S ratio would be typical for a company that's only expected to deliver moderate growth, and importantly, perform in line with the industry.
Retrospectively, the last year delivered a frustrating 84% decrease to the company's top line. Even so, admirably revenue has lifted 39% in aggregate from three years ago, notwithstanding the last 12 months. So we can start by confirming that the company has generally done a very good job of growing revenue over that time, even though it had some hiccups along the way.
Comparing the recent medium-term revenue trends against the industry's one-year growth forecast of 14% shows it's noticeably less attractive.
In light of this, it's curious that TBK & Sons Holdings' P/S sits in line with the majority of other companies. It seems most investors are ignoring the fairly limited recent growth rates and are willing to pay up for exposure to the stock. They may be setting themselves up for future disappointment if the P/S falls to levels more in line with recent growth rates.
What We Can Learn From TBK & Sons Holdings' P/S?
With its share price dropping off a cliff, the P/S for TBK & Sons Holdings looks to be in line with the rest of the Energy Services industry. Using the price-to-sales ratio alone to determine if you should sell your stock isn't sensible, however it can be a practical guide to the company's future prospects.
We've established that TBK & Sons Holdings' average P/S is a bit surprising since its recent three-year growth is lower than the wider industry forecast. Right now we are uncomfortable with the P/S as this revenue performance isn't likely to support a more positive sentiment for long. Unless the recent medium-term conditions improve, it's hard to accept the current share price as fair value.
Before you settle on your opinion, we've discovered 3 warning signs for TBK & Sons Holdings (1 is potentially serious!) that you should be aware of.
If strong companies turning a profit tickle your fancy, then you'll want to check out this free list of interesting companies that trade on a low P/E (but have proven they can grow earnings).
Valuation is complex, but we're here to simplify it.
Discover if TBK & Sons Holdings might be undervalued or overvalued with our detailed analysis, featuring fair value estimates, potential risks, dividends, insider trades, and its financial condition.
Access Free AnalysisHave feedback on this article? Concerned about the content? Get in touch with us directly. Alternatively, email editorial-team (at) simplywallst.com.
This article by Simply Wall St is general in nature. We provide commentary based on historical data and analyst forecasts only using an unbiased methodology and our articles are not intended to be financial advice. It does not constitute a recommendation to buy or sell any stock, and does not take account of your objectives, or your financial situation. We aim to bring you long-term focused analysis driven by fundamental data. Note that our analysis may not factor in the latest price-sensitive company announcements or qualitative material. Simply Wall St has no position in any stocks mentioned.
Have feedback on this article? Concerned about the content? Get in touch with us directly. Alternatively, email editorial-team@simplywallst.com
About SEHK:1960
TBK & Sons Holdings
An investment holding company, undertakes civil and structural works in the oil and gas industry in Malaysia and the People’s Republic of China.
Excellent balance sheet with low risk.
Similar Companies
Market Insights

Advertisement
Weekly Picks
FA

FAI on Arabian Internet and Communication Services ·
Solutions by stc: 34% Upside in Saudi's Digital Transformation Leader
Fair Value:ر.س342.2335.5% undervalued
10 followersusers have followed this narrative
1 commentusers have commented on this narrative
4 likesusers have liked this narrative
RO


RobertoAllende on NVIDIA ·
The AI Infrastructure Giant Grows Into Its Valuation
Fair Value:US$345.0747.9% undervalued
28 followersusers have followed this narrative
28 commentsusers have commented on this narrative
21 likesusers have liked this narrative
Recently Updated Narratives
TA

Talos on NVIDIA ·
Not a Bubble, But the "Industrial Revolution 4.0" Engine
Fair Value:US$294.9239.0% undervalued
1 followerusers have followed this narrative
0 commentsusers have commented on this narrative
0 likesusers have liked this narrative
TA

Talos on Advanced Micro Devices ·
The "David vs. Goliath" AI Trade – Why Second Place is Worth Billions
Fair Value:US$416.4647.2% undervalued
2 followersusers have followed this narrative
0 commentsusers have commented on this narrative
0 likesusers have liked this narrative
TA

Talos on PayPal Holdings ·
The "Sleeping Giant" Wakes Up – Efficiency & Monetization
Fair Value:US$174.9264.2% undervalued
4 followersusers have followed this narrative
0 commentsusers have commented on this narrative
0 likesusers have liked this narrative
Popular Narratives
TH


TheWallstreetKing on MicroVision ·
MicroVision will explode future revenue by 380.37% with a vision towards success
Fair Value:US$6098.6% undervalued
111 followersusers have followed this narrative
11 commentsusers have commented on this narrative
22 likesusers have liked this narrative
AN

AnalystConsensusTarget on NVIDIA ·
NVDA: Expanding AI Demand Will Drive Major Data Center Investments Through 2026
Fair Value:US$250.3928.1% undervalued
945 followersusers have followed this narrative
6 commentsusers have commented on this narrative
24 likesusers have liked this narrative
OS


oscargarcia on Alphabet ·
The company that turned a verb into a global necessity and basically runs the modern internet, digital ads, smartphones, maps, and AI.
Fair Value:US$3407.4% undervalued
146 followersusers have followed this narrative
6 commentsusers have commented on this narrative
18 likesusers have liked this narrative