- Hong Kong
- /
- Hospitality
- /
- SEHK:8493
Dragon King Group Holdings Limited's (HKG:8493) 29% Share Price Plunge Could Signal Some Risk


The Dragon King Group Holdings Limited (HKG:8493) share price has fared very poorly over the last month, falling by a substantial 29%. Longer-term shareholders will rue the drop in the share price, since it's now virtually flat for the year after a promising few quarters.
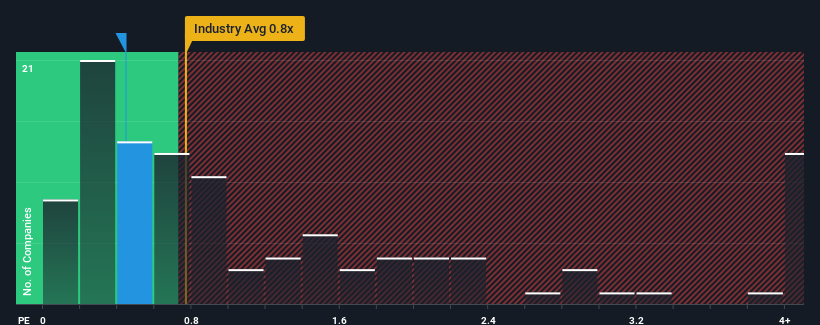
In spite of the heavy fall in price, you could still be forgiven for feeling indifferent about Dragon King Group Holdings' P/S ratio of 0.4x, since the median price-to-sales (or "P/S") ratio for the Hospitality industry in Hong Kong is also close to 0.8x. However, investors might be overlooking a clear opportunity or potential setback if there is no rational basis for the P/S.
Check out our latest analysis for Dragon King Group Holdings
How Dragon King Group Holdings Has Been Performing
Recent times have been quite advantageous for Dragon King Group Holdings as its revenue has been rising very briskly. Perhaps the market is expecting future revenue performance to taper off, which has kept the P/S from rising. Those who are bullish on Dragon King Group Holdings will be hoping that this isn't the case, so that they can pick up the stock at a lower valuation.
Although there are no analyst estimates available for Dragon King Group Holdings, take a look at this free data-rich visualisation to see how the company stacks up on earnings, revenue and cash flow.Do Revenue Forecasts Match The P/S Ratio?
In order to justify its P/S ratio, Dragon King Group Holdings would need to produce growth that's similar to the industry.
If we review the last year of revenue growth, the company posted a terrific increase of 31%. Still, revenue has fallen 47% in total from three years ago, which is quite disappointing. Accordingly, shareholders would have felt downbeat about the medium-term rates of revenue growth.
Weighing that medium-term revenue trajectory against the broader industry's one-year forecast for expansion of 20% shows it's an unpleasant look.
In light of this, it's somewhat alarming that Dragon King Group Holdings' P/S sits in line with the majority of other companies. Apparently many investors in the company are way less bearish than recent times would indicate and aren't willing to let go of their stock right now. Only the boldest would assume these prices are sustainable as a continuation of recent revenue trends is likely to weigh on the share price eventually.
What Does Dragon King Group Holdings' P/S Mean For Investors?
With its share price dropping off a cliff, the P/S for Dragon King Group Holdings looks to be in line with the rest of the Hospitality industry. Typically, we'd caution against reading too much into price-to-sales ratios when settling on investment decisions, though it can reveal plenty about what other market participants think about the company.
The fact that Dragon King Group Holdings currently trades at a P/S on par with the rest of the industry is surprising to us since its recent revenues have been in decline over the medium-term, all while the industry is set to grow. When we see revenue heading backwards in the context of growing industry forecasts, it'd make sense to expect a possible share price decline on the horizon, sending the moderate P/S lower. Unless the recent medium-term conditions improve markedly, investors will have a hard time accepting the share price as fair value.
Before you take the next step, you should know about the 6 warning signs for Dragon King Group Holdings (4 are significant!) that we have uncovered.
Of course, profitable companies with a history of great earnings growth are generally safer bets. So you may wish to see this free collection of other companies that have reasonable P/E ratios and have grown earnings strongly.
If you're looking to trade Dragon King Group Holdings, open an account with the lowest-cost platform trusted by professionals, Interactive Brokers.
With clients in over 200 countries and territories, and access to 160 markets, IBKR lets you trade stocks, options, futures, forex, bonds and funds from a single integrated account.
Enjoy no hidden fees, no account minimums, and FX conversion rates as low as 0.03%, far better than what most brokers offer.
Sponsored ContentNew: Manage All Your Stock Portfolios in One Place
We've created the ultimate portfolio companion for stock investors, and it's free.
• Connect an unlimited number of Portfolios and see your total in one currency
• Be alerted to new Warning Signs or Risks via email or mobile
• Track the Fair Value of your stocks
Have feedback on this article? Concerned about the content? Get in touch with us directly. Alternatively, email editorial-team (at) simplywallst.com.
This article by Simply Wall St is general in nature. We provide commentary based on historical data and analyst forecasts only using an unbiased methodology and our articles are not intended to be financial advice. It does not constitute a recommendation to buy or sell any stock, and does not take account of your objectives, or your financial situation. We aim to bring you long-term focused analysis driven by fundamental data. Note that our analysis may not factor in the latest price-sensitive company announcements or qualitative material. Simply Wall St has no position in any stocks mentioned.
About SEHK:8493
Dragon King Group Holdings
An investment holding company, operates and manages Cantonese full-service restaurants in Hong Kong.
Low and slightly overvalued.
Market Insights

Community Narratives


