
Advertisement
- Hong Kong
- /
- Hospitality
- /
- SEHK:8052
Lacklustre Performance Is Driving Luk Hing Entertainment Group Holdings Limited's (HKG:8052) 31% Price Drop
Unfortunately for some shareholders, the Luk Hing Entertainment Group Holdings Limited (HKG:8052) share price has dived 31% in the last thirty days, prolonging recent pain. For any long-term shareholders, the last month ends a year to forget by locking in a 74% share price decline.
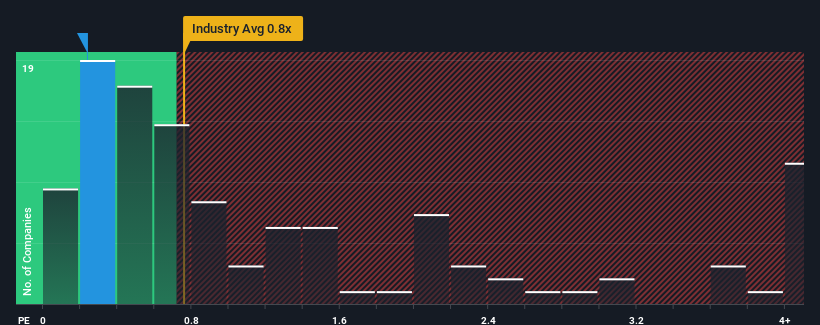
Since its price has dipped substantially, considering around half the companies operating in Hong Kong's Hospitality industry have price-to-sales ratios (or "P/S") above 0.8x, you may consider Luk Hing Entertainment Group Holdings as an solid investment opportunity with its 0.2x P/S ratio. Although, it's not wise to just take the P/S at face value as there may be an explanation why it's limited.
See our latest analysis for Luk Hing Entertainment Group Holdings
How Has Luk Hing Entertainment Group Holdings Performed Recently?
With revenue growth that's exceedingly strong of late, Luk Hing Entertainment Group Holdings has been doing very well. One possibility is that the P/S ratio is low because investors think this strong revenue growth might actually underperform the broader industry in the near future. Those who are bullish on Luk Hing Entertainment Group Holdings will be hoping that this isn't the case, so that they can pick up the stock at a lower valuation.
We don't have analyst forecasts, but you can see how recent trends are setting up the company for the future by checking out our free report on Luk Hing Entertainment Group Holdings' earnings, revenue and cash flow.Do Revenue Forecasts Match The Low P/S Ratio?
Luk Hing Entertainment Group Holdings' P/S ratio would be typical for a company that's only expected to deliver limited growth, and importantly, perform worse than the industry.
Taking a look back first, we see that the company grew revenue by an impressive 73% last year. Despite this strong recent growth, it's still struggling to catch up as its three-year revenue frustratingly shrank by 38% overall. So unfortunately, we have to acknowledge that the company has not done a great job of growing revenues over that time.
Comparing that to the industry, which is predicted to deliver 21% growth in the next 12 months, the company's downward momentum based on recent medium-term revenue results is a sobering picture.
In light of this, it's understandable that Luk Hing Entertainment Group Holdings' P/S would sit below the majority of other companies. Nonetheless, there's no guarantee the P/S has reached a floor yet with revenue going in reverse. Even just maintaining these prices could be difficult to achieve as recent revenue trends are already weighing down the shares.
The Final Word
Luk Hing Entertainment Group Holdings' P/S has taken a dip along with its share price. It's argued the price-to-sales ratio is an inferior measure of value within certain industries, but it can be a powerful business sentiment indicator.
It's no surprise that Luk Hing Entertainment Group Holdings maintains its low P/S off the back of its sliding revenue over the medium-term. At this stage investors feel the potential for an improvement in revenue isn't great enough to justify a higher P/S ratio. If recent medium-term revenue trends continue, it's hard to see the share price moving strongly in either direction in the near future under these circumstances.
And what about other risks? Every company has them, and we've spotted 6 warning signs for Luk Hing Entertainment Group Holdings (of which 3 are a bit concerning!) you should know about.
If these risks are making you reconsider your opinion on Luk Hing Entertainment Group Holdings, explore our interactive list of high quality stocks to get an idea of what else is out there.
New: AI Stock Screener & Alerts
Our new AI Stock Screener scans the market every day to uncover opportunities.
• Dividend Powerhouses (3%+ Yield)
• Undervalued Small Caps with Insider Buying
• High growth Tech and AI Companies
Or build your own from over 50 metrics.
Have feedback on this article? Concerned about the content? Get in touch with us directly. Alternatively, email editorial-team (at) simplywallst.com.
This article by Simply Wall St is general in nature. We provide commentary based on historical data and analyst forecasts only using an unbiased methodology and our articles are not intended to be financial advice. It does not constitute a recommendation to buy or sell any stock, and does not take account of your objectives, or your financial situation. We aim to bring you long-term focused analysis driven by fundamental data. Note that our analysis may not factor in the latest price-sensitive company announcements or qualitative material. Simply Wall St has no position in any stocks mentioned.
About SEHK:8052
Luk Hing Entertainment Group Holdings
An investment holding company, engages in the food and beverage, and entertainment businesses in Hong Kong.
Moderate risk and slightly overvalued.
Market Insights

Advertisement
Weekly Picks
FA

FAI on Arabian Internet and Communication Services ·
Solutions by stc: 34% Upside in Saudi's Digital Transformation Leader
Fair Value:ر.س342.2335.7% undervalued
9 followersusers have followed this narrative
1 commentusers have commented on this narrative
3 likesusers have liked this narrative
RO


RobertoAllende on NVIDIA ·
The AI Infrastructure Giant Grows Into Its Valuation
Fair Value:US$345.0747.9% undervalued
27 followersusers have followed this narrative
28 commentsusers have commented on this narrative
21 likesusers have liked this narrative
Recently Updated Narratives
TA


Talos on PayPal Holdings ·
The "Sleeping Giant" Wakes Up – Efficiency & Monetization
Fair Value:US$174.9264.2% undervalued
1 followerusers have followed this narrative
0 commentsusers have commented on this narrative
0 likesusers have liked this narrative
TA

Talos on Pagaya Technologies ·
The "Rate Cut" Supercycle Winner – Profitable & Accelerating
Fair Value:US$170.685.9% undervalued
1 followerusers have followed this narrative
0 commentsusers have commented on this narrative
0 likesusers have liked this narrative
TA

Talos on Archer Aviation ·
The Industrialist of the Skies – Scaling with "Automotive DNA
Fair Value:US$16.3254.3% undervalued
1 followerusers have followed this narrative
0 commentsusers have commented on this narrative
0 likesusers have liked this narrative
Popular Narratives
TH


TheWallstreetKing on MicroVision ·
MicroVision will explode future revenue by 380.37% with a vision towards success
Fair Value:US$6098.6% undervalued
110 followersusers have followed this narrative
11 commentsusers have commented on this narrative
22 likesusers have liked this narrative
AN

AnalystConsensusTarget on NVIDIA ·
NVDA: Expanding AI Demand Will Drive Major Data Center Investments Through 2026
Fair Value:US$250.3928.1% undervalued
945 followersusers have followed this narrative
6 commentsusers have commented on this narrative
24 likesusers have liked this narrative
OS


oscargarcia on Alphabet ·
The company that turned a verb into a global necessity and basically runs the modern internet, digital ads, smartphones, maps, and AI.
Fair Value:US$3407.4% undervalued
146 followersusers have followed this narrative
6 commentsusers have commented on this narrative
18 likesusers have liked this narrative