
Advertisement
- Hong Kong
- /
- Hospitality
- /
- SEHK:703
What Future Bright Holdings Limited's (HKG:703) 33% Share Price Gain Is Not Telling You
Future Bright Holdings Limited (HKG:703) shares have continued their recent momentum with a 33% gain in the last month alone. Taking a wider view, although not as strong as the last month, the full year gain of 22% is also fairly reasonable.
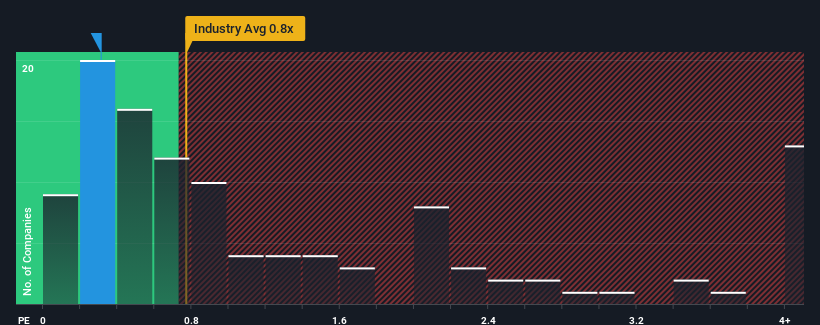
Although its price has surged higher, there still wouldn't be many who think Future Bright Holdings' price-to-sales (or "P/S") ratio of 0.3x is worth a mention when the median P/S in Hong Kong's Hospitality industry is similar at about 0.8x. While this might not raise any eyebrows, if the P/S ratio is not justified investors could be missing out on a potential opportunity or ignoring looming disappointment.
Check out our latest analysis for Future Bright Holdings
What Does Future Bright Holdings' P/S Mean For Shareholders?
With revenue growth that's exceedingly strong of late, Future Bright Holdings has been doing very well. The P/S is probably moderate because investors think this strong revenue growth might not be enough to outperform the broader industry in the near future. If that doesn't eventuate, then existing shareholders have reason to be feeling optimistic about the future direction of the share price.
Although there are no analyst estimates available for Future Bright Holdings, take a look at this free data-rich visualisation to see how the company stacks up on earnings, revenue and cash flow.Is There Some Revenue Growth Forecasted For Future Bright Holdings?
Future Bright Holdings' P/S ratio would be typical for a company that's only expected to deliver moderate growth, and importantly, perform in line with the industry.
If we review the last year of revenue growth, the company posted a terrific increase of 72%. The latest three year period has also seen a 17% overall rise in revenue, aided extensively by its short-term performance. So we can start by confirming that the company has actually done a good job of growing revenue over that time.
Comparing the recent medium-term revenue trends against the industry's one-year growth forecast of 20% shows it's noticeably less attractive.
With this information, we find it interesting that Future Bright Holdings is trading at a fairly similar P/S compared to the industry. It seems most investors are ignoring the fairly limited recent growth rates and are willing to pay up for exposure to the stock. They may be setting themselves up for future disappointment if the P/S falls to levels more in line with recent growth rates.
What Does Future Bright Holdings' P/S Mean For Investors?
Its shares have lifted substantially and now Future Bright Holdings' P/S is back within range of the industry median. Typically, we'd caution against reading too much into price-to-sales ratios when settling on investment decisions, though it can reveal plenty about what other market participants think about the company.
Our examination of Future Bright Holdings revealed its poor three-year revenue trends aren't resulting in a lower P/S as per our expectations, given they look worse than current industry outlook. Right now we are uncomfortable with the P/S as this revenue performance isn't likely to support a more positive sentiment for long. Unless the recent medium-term conditions improve, it's hard to accept the current share price as fair value.
You should always think about risks. Case in point, we've spotted 3 warning signs for Future Bright Holdings you should be aware of.
If companies with solid past earnings growth is up your alley, you may wish to see this free collection of other companies with strong earnings growth and low P/E ratios.
New: AI Stock Screener & Alerts
Our new AI Stock Screener scans the market every day to uncover opportunities.
• Dividend Powerhouses (3%+ Yield)
• Undervalued Small Caps with Insider Buying
• High growth Tech and AI Companies
Or build your own from over 50 metrics.
Have feedback on this article? Concerned about the content? Get in touch with us directly. Alternatively, email editorial-team (at) simplywallst.com.
This article by Simply Wall St is general in nature. We provide commentary based on historical data and analyst forecasts only using an unbiased methodology and our articles are not intended to be financial advice. It does not constitute a recommendation to buy or sell any stock, and does not take account of your objectives, or your financial situation. We aim to bring you long-term focused analysis driven by fundamental data. Note that our analysis may not factor in the latest price-sensitive company announcements or qualitative material. Simply Wall St has no position in any stocks mentioned.
About SEHK:703
Future Bright Holdings
An investment holding company, engages in the operation of restaurants, catering, and food souvenir businesses in Hong Kong, Macau, and Mainland China.
Moderate risk and good value.
Market Insights

Advertisement
Weekly Picks
RO


RockeTeller on Santacruz Silver Mining ·
Crazy Undervalued 42 Baggers Silver Play (Active & Running Mine)
Fair Value:CA$8696.7% undervalued
8 followersusers have followed this narrative
5 commentsusers have commented on this narrative
0 likesusers have liked this narrative
RO


Robbo on Fiducian Group ·
Fiducian: Compliance Clouds or Value Opportunity?
Fair Value:AU$126.3% undervalued
1 followerusers have followed this narrative
0 commentsusers have commented on this narrative
0 likesusers have liked this narrative
WO

woodworthfund on Willamette Valley Vineyards ·
Willamette Valley Vineyards (WVVI): Not-So-Great Value
Fair Value:US$242.5% overvalued
2 followersusers have followed this narrative
0 commentsusers have commented on this narrative
1 likeusers have liked this narrative
Recently Updated Narratives
TA


Talos on Marvell Technology ·
The Great Strategy Swap – Selling "Old Auto" to Buy "Future Light"
Fair Value:US$155.3740.2% undervalued
1 followerusers have followed this narrative
0 commentsusers have commented on this narrative
0 likesusers have liked this narrative
TA

Talos on NVIDIA ·
Not a Bubble, But the "Industrial Revolution 4.0" Engine
Fair Value:US$294.9238.5% undervalued
3 followersusers have followed this narrative
0 commentsusers have commented on this narrative
0 likesusers have liked this narrative
TA

Talos on Advanced Micro Devices ·
The "David vs. Goliath" AI Trade – Why Second Place is Worth Billions
Fair Value:US$416.4648.3% undervalued
2 followersusers have followed this narrative
0 commentsusers have commented on this narrative
0 likesusers have liked this narrative
Popular Narratives
TH


TheWallstreetKing on MicroVision ·
MicroVision will explode future revenue by 380.37% with a vision towards success
Fair Value:US$6098.6% undervalued
112 followersusers have followed this narrative
11 commentsusers have commented on this narrative
22 likesusers have liked this narrative
AN

AnalystConsensusTarget on NVIDIA ·
NVDA: Expanding AI Demand Will Drive Major Data Center Investments Through 2026
Fair Value:US$250.3927.6% undervalued
946 followersusers have followed this narrative
6 commentsusers have commented on this narrative
24 likesusers have liked this narrative
OS


oscargarcia on Alphabet ·
The company that turned a verb into a global necessity and basically runs the modern internet, digital ads, smartphones, maps, and AI.
Fair Value:US$3407.2% undervalued
147 followersusers have followed this narrative
6 commentsusers have commented on this narrative
18 likesusers have liked this narrative