- Hong Kong
- /
- Hospitality
- /
- SEHK:1928
Here's What's Concerning About Sands China's (HKG:1928) Returns On Capital


When it comes to investing, there are some useful financial metrics that can warn us when a business is potentially in trouble. More often than not, we'll see a declining return on capital employed (ROCE) and a declining amount of capital employed. This reveals that the company isn't compounding shareholder wealth because returns are falling and its net asset base is shrinking. So after glancing at the trends within Sands China (HKG:1928), we weren't too hopeful.
Understanding Return On Capital Employed (ROCE)
Just to clarify if you're unsure, ROCE is a metric for evaluating how much pre-tax income (in percentage terms) a company earns on the capital invested in its business. To calculate this metric for Sands China, this is the formula:
Return on Capital Employed = Earnings Before Interest and Tax (EBIT) ÷ (Total Assets - Current Liabilities)
0.14 = US$1.2b ÷ (US$10b - US$1.4b) (Based on the trailing twelve months to December 2023).
Therefore, Sands China has an ROCE of 14%. In absolute terms, that's a satisfactory return, but compared to the Hospitality industry average of 6.0% it's much better.
Check out our latest analysis for Sands China
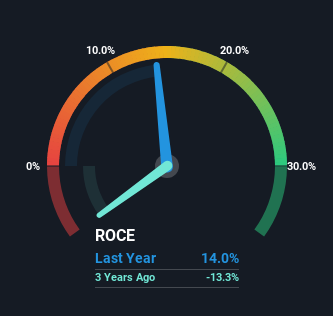
In the above chart we have measured Sands China's prior ROCE against its prior performance, but the future is arguably more important. If you'd like, you can check out the forecasts from the analysts covering Sands China for free.
What Can We Tell From Sands China's ROCE Trend?
We are a bit worried about the trend of returns on capital at Sands China. To be more specific, the ROCE was 23% five years ago, but since then it has dropped noticeably. And on the capital employed front, the business is utilizing roughly the same amount of capital as it was back then. Since returns are falling and the business has the same amount of assets employed, this can suggest it's a mature business that hasn't had much growth in the last five years. So because these trends aren't typically conducive to creating a multi-bagger, we wouldn't hold our breath on Sands China becoming one if things continue as they have.
The Bottom Line
All in all, the lower returns from the same amount of capital employed aren't exactly signs of a compounding machine. Long term shareholders who've owned the stock over the last five years have experienced a 44% depreciation in their investment, so it appears the market might not like these trends either. Unless there is a shift to a more positive trajectory in these metrics, we would look elsewhere.
If you'd like to know about the risks facing Sands China, we've discovered 2 warning signs that you should be aware of.
If you want to search for solid companies with great earnings, check out this free list of companies with good balance sheets and impressive returns on equity.
New: Manage All Your Stock Portfolios in One Place
We've created the ultimate portfolio companion for stock investors, and it's free.
• Connect an unlimited number of Portfolios and see your total in one currency
• Be alerted to new Warning Signs or Risks via email or mobile
• Track the Fair Value of your stocks
Have feedback on this article? Concerned about the content? Get in touch with us directly. Alternatively, email editorial-team (at) simplywallst.com.
This article by Simply Wall St is general in nature. We provide commentary based on historical data and analyst forecasts only using an unbiased methodology and our articles are not intended to be financial advice. It does not constitute a recommendation to buy or sell any stock, and does not take account of your objectives, or your financial situation. We aim to bring you long-term focused analysis driven by fundamental data. Note that our analysis may not factor in the latest price-sensitive company announcements or qualitative material. Simply Wall St has no position in any stocks mentioned.
About SEHK:1928
Sands China
Develops, owns, and operates integrated resorts and casinos in Macao.
Reasonable growth potential and fair value.
