- Hong Kong
- /
- Consumer Services
- /
- SEHK:1773
Tianli International Holdings Limited (HKG:1773) Stock Rockets 40% As Investors Are Less Pessimistic Than Expected


Tianli International Holdings Limited (HKG:1773) shares have had a really impressive month, gaining 40% after a shaky period beforehand. The last 30 days bring the annual gain to a very sharp 78%.
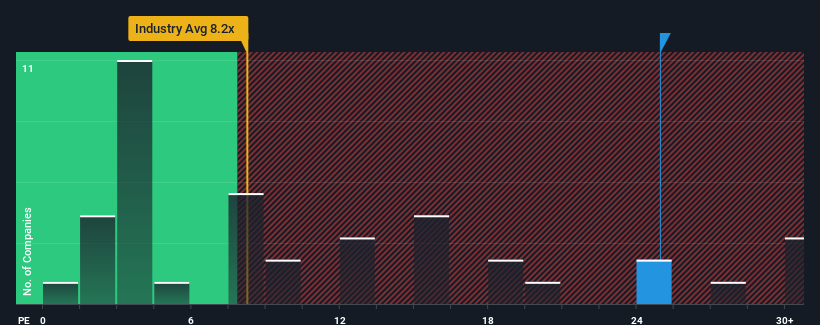
After such a large jump in price, Tianli International Holdings may be sending very bearish signals at the moment with a price-to-earnings (or "P/E") ratio of 24.9x, since almost half of all companies in Hong Kong have P/E ratios under 8x and even P/E's lower than 5x are not unusual. Nonetheless, we'd need to dig a little deeper to determine if there is a rational basis for the highly elevated P/E.
Tianli International Holdings certainly has been doing a great job lately as it's been growing earnings at a really rapid pace. It seems that many are expecting the strong earnings performance to beat most other companies over the coming period, which has increased investors’ willingness to pay up for the stock. If not, then existing shareholders might be a little nervous about the viability of the share price.
View our latest analysis for Tianli International Holdings
Does Growth Match The High P/E?
Tianli International Holdings' P/E ratio would be typical for a company that's expected to deliver very strong growth, and importantly, perform much better than the market.
If we review the last year of earnings growth, the company posted a terrific increase of 247%. Still, incredibly EPS has fallen 9.1% in total from three years ago, which is quite disappointing. So unfortunately, we have to acknowledge that the company has not done a great job of growing earnings over that time.
Comparing that to the market, which is predicted to deliver 22% growth in the next 12 months, the company's downward momentum based on recent medium-term earnings results is a sobering picture.
With this information, we find it concerning that Tianli International Holdings is trading at a P/E higher than the market. It seems most investors are ignoring the recent poor growth rate and are hoping for a turnaround in the company's business prospects. There's a very good chance existing shareholders are setting themselves up for future disappointment if the P/E falls to levels more in line with the recent negative growth rates.
The Key Takeaway
Shares in Tianli International Holdings have built up some good momentum lately, which has really inflated its P/E. We'd say the price-to-earnings ratio's power isn't primarily as a valuation instrument but rather to gauge current investor sentiment and future expectations.
Our examination of Tianli International Holdings revealed its shrinking earnings over the medium-term aren't impacting its high P/E anywhere near as much as we would have predicted, given the market is set to grow. Right now we are increasingly uncomfortable with the high P/E as this earnings performance is highly unlikely to support such positive sentiment for long. Unless the recent medium-term conditions improve markedly, it's very challenging to accept these prices as being reasonable.
Having said that, be aware Tianli International Holdings is showing 1 warning sign in our investment analysis, you should know about.
Of course, you might also be able to find a better stock than Tianli International Holdings. So you may wish to see this free collection of other companies that have reasonable P/E ratios and have grown earnings strongly.
If you're looking to trade Tianli International Holdings, open an account with the lowest-cost platform trusted by professionals, Interactive Brokers.
With clients in over 200 countries and territories, and access to 160 markets, IBKR lets you trade stocks, options, futures, forex, bonds and funds from a single integrated account.
Enjoy no hidden fees, no account minimums, and FX conversion rates as low as 0.03%, far better than what most brokers offer.
Sponsored ContentValuation is complex, but we're here to simplify it.
Discover if Tianli International Holdings might be undervalued or overvalued with our detailed analysis, featuring fair value estimates, potential risks, dividends, insider trades, and its financial condition.
Access Free AnalysisHave feedback on this article? Concerned about the content? Get in touch with us directly. Alternatively, email editorial-team (at) simplywallst.com.
This article by Simply Wall St is general in nature. We provide commentary based on historical data and analyst forecasts only using an unbiased methodology and our articles are not intended to be financial advice. It does not constitute a recommendation to buy or sell any stock, and does not take account of your objectives, or your financial situation. We aim to bring you long-term focused analysis driven by fundamental data. Note that our analysis may not factor in the latest price-sensitive company announcements or qualitative material. Simply Wall St has no position in any stocks mentioned.
About SEHK:1773
Tianli International Holdings
An investment holding company, provides education management and diversified services in China.
Exceptional growth potential with outstanding track record.
Market Insights

Community Narratives


