
Advertisement
- Hong Kong
- /
- Food and Staples Retail
- /
- SEHK:6808
There's Reason For Concern Over Sun Art Retail Group Limited's (HKG:6808) Massive 34% Price Jump
Sun Art Retail Group Limited (HKG:6808) shareholders would be excited to see that the share price has had a great month, posting a 34% gain and recovering from prior weakness. Not all shareholders will be feeling jubilant, since the share price is still down a very disappointing 46% in the last twelve months.
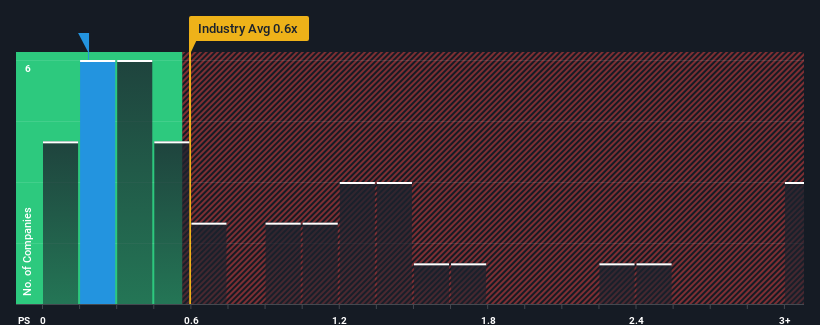
In spite of the firm bounce in price, it's still not a stretch to say that Sun Art Retail Group's price-to-sales (or "P/S") ratio of 0.2x right now seems quite "middle-of-the-road" compared to the Consumer Retailing industry in Hong Kong, where the median P/S ratio is around 0.6x. However, investors might be overlooking a clear opportunity or potential setback if there is no rational basis for the P/S.
See our latest analysis for Sun Art Retail Group
What Does Sun Art Retail Group's P/S Mean For Shareholders?
Sun Art Retail Group hasn't been tracking well recently as its declining revenue compares poorly to other companies, which have seen some growth in their revenues on average. Perhaps the market is expecting its poor revenue performance to improve, keeping the P/S from dropping. You'd really hope so, otherwise you're paying a relatively elevated price for a company with this sort of growth profile.
If you'd like to see what analysts are forecasting going forward, you should check out our free report on Sun Art Retail Group.What Are Revenue Growth Metrics Telling Us About The P/S?
The only time you'd be comfortable seeing a P/S like Sun Art Retail Group's is when the company's growth is tracking the industry closely.
In reviewing the last year of financials, we were disheartened to see the company's revenues fell to the tune of 9.6%. The last three years don't look nice either as the company has shrunk revenue by 19% in aggregate. Accordingly, shareholders would have felt downbeat about the medium-term rates of revenue growth.
Shifting to the future, estimates from the analysts covering the company suggest revenue should grow by 3.7% per annum over the next three years. Meanwhile, the rest of the industry is forecast to expand by 14% each year, which is noticeably more attractive.
With this information, we find it interesting that Sun Art Retail Group is trading at a fairly similar P/S compared to the industry. Apparently many investors in the company are less bearish than analysts indicate and aren't willing to let go of their stock right now. These shareholders may be setting themselves up for future disappointment if the P/S falls to levels more in line with the growth outlook.
The Bottom Line On Sun Art Retail Group's P/S
Its shares have lifted substantially and now Sun Art Retail Group's P/S is back within range of the industry median. Generally, our preference is to limit the use of the price-to-sales ratio to establishing what the market thinks about the overall health of a company.
Our look at the analysts forecasts of Sun Art Retail Group's revenue prospects has shown that its inferior revenue outlook isn't negatively impacting its P/S as much as we would have predicted. When we see companies with a relatively weaker revenue outlook compared to the industry, we suspect the share price is at risk of declining, sending the moderate P/S lower. A positive change is needed in order to justify the current price-to-sales ratio.
The company's balance sheet is another key area for risk analysis. You can assess many of the main risks through our free balance sheet analysis for Sun Art Retail Group with six simple checks.
If these risks are making you reconsider your opinion on Sun Art Retail Group, explore our interactive list of high quality stocks to get an idea of what else is out there.
New: Manage All Your Stock Portfolios in One Place
We've created the ultimate portfolio companion for stock investors, and it's free.
• Connect an unlimited number of Portfolios and see your total in one currency
• Be alerted to new Warning Signs or Risks via email or mobile
• Track the Fair Value of your stocks
Have feedback on this article? Concerned about the content? Get in touch with us directly. Alternatively, email editorial-team (at) simplywallst.com.
This article by Simply Wall St is general in nature. We provide commentary based on historical data and analyst forecasts only using an unbiased methodology and our articles are not intended to be financial advice. It does not constitute a recommendation to buy or sell any stock, and does not take account of your objectives, or your financial situation. We aim to bring you long-term focused analysis driven by fundamental data. Note that our analysis may not factor in the latest price-sensitive company announcements or qualitative material. Simply Wall St has no position in any stocks mentioned.
About SEHK:6808
Sun Art Retail Group
An investment holding company, operates brick-and-mortar stores and online sales channels in the People’s Republic of China.
Moderate growth potential with mediocre balance sheet.
Similar Companies
Market Insights

Advertisement
Community Narratives
Pinterest will surge as advertising innovations ignite revenue growth
Fair Value US$42.63|26.3% undervalued
BR
Community Contributor
Brambles' Revenue Set to Climb 14% with Profit Margins Following
Fair Value AU$21.90|4.8% overvalued
RO
Community Contributor
Challenging Future for STG as Organic Sales Decline by 8.8%
Fair Value DKK 116.13|26.8% undervalued
KA
Community Contributor