
Advertisement
Warren Buffett famously said, 'Volatility is far from synonymous with risk.' So it might be obvious that you need to consider debt, when you think about how risky any given stock is, because too much debt can sink a company. We can see that Skyworth Group Limited (HKG:751) does use debt in its business. But is this debt a concern to shareholders?
What Risk Does Debt Bring?
Debt and other liabilities become risky for a business when it cannot easily fulfill those obligations, either with free cash flow or by raising capital at an attractive price. In the worst case scenario, a company can go bankrupt if it cannot pay its creditors. While that is not too common, we often do see indebted companies permanently diluting shareholders because lenders force them to raise capital at a distressed price. Of course, the upside of debt is that it often represents cheap capital, especially when it replaces dilution in a company with the ability to reinvest at high rates of return. When we examine debt levels, we first consider both cash and debt levels, together.
Check out our latest analysis for Skyworth Group
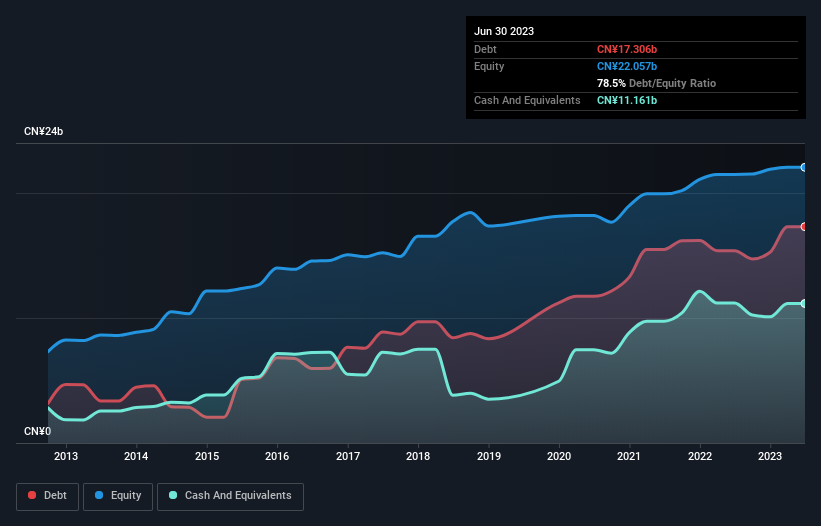
What Is Skyworth Group's Net Debt?
You can click the graphic below for the historical numbers, but it shows that as of June 2023 Skyworth Group had CN¥17.3b of debt, an increase on CN¥15.4b, over one year. However, because it has a cash reserve of CN¥11.2b, its net debt is less, at about CN¥6.15b.
A Look At Skyworth Group's Liabilities
According to the last reported balance sheet, Skyworth Group had liabilities of CN¥39.6b due within 12 months, and liabilities of CN¥8.52b due beyond 12 months. Offsetting these obligations, it had cash of CN¥11.2b as well as receivables valued at CN¥19.0b due within 12 months. So it has liabilities totalling CN¥18.0b more than its cash and near-term receivables, combined.
The deficiency here weighs heavily on the CN¥6.98b company itself, as if a child were struggling under the weight of an enormous back-pack full of books, his sports gear, and a trumpet. So we'd watch its balance sheet closely, without a doubt. At the end of the day, Skyworth Group would probably need a major re-capitalization if its creditors were to demand repayment.
We use two main ratios to inform us about debt levels relative to earnings. The first is net debt divided by earnings before interest, tax, depreciation, and amortization (EBITDA), while the second is how many times its earnings before interest and tax (EBIT) covers its interest expense (or its interest cover, for short). Thus we consider debt relative to earnings both with and without depreciation and amortization expenses.
Skyworth Group has a debt to EBITDA ratio of 4.1 and its EBIT covered its interest expense 6.4 times. Taken together this implies that, while we wouldn't want to see debt levels rise, we think it can handle its current leverage. Shareholders should be aware that Skyworth Group's EBIT was down 30% last year. If that decline continues then paying off debt will be harder than selling foie gras at a vegan convention. The balance sheet is clearly the area to focus on when you are analysing debt. But ultimately the future profitability of the business will decide if Skyworth Group can strengthen its balance sheet over time. So if you want to see what the professionals think, you might find this free report on analyst profit forecasts to be interesting.
Finally, a business needs free cash flow to pay off debt; accounting profits just don't cut it. So the logical step is to look at the proportion of that EBIT that is matched by actual free cash flow. Happily for any shareholders, Skyworth Group actually produced more free cash flow than EBIT over the last three years. There's nothing better than incoming cash when it comes to staying in your lenders' good graces.
Our View
On the face of it, Skyworth Group's EBIT growth rate left us tentative about the stock, and its level of total liabilities was no more enticing than the one empty restaurant on the busiest night of the year. But on the bright side, its conversion of EBIT to free cash flow is a good sign, and makes us more optimistic. Overall, it seems to us that Skyworth Group's balance sheet is really quite a risk to the business. For this reason we're pretty cautious about the stock, and we think shareholders should keep a close eye on its liquidity. There's no doubt that we learn most about debt from the balance sheet. However, not all investment risk resides within the balance sheet - far from it. To that end, you should be aware of the 1 warning sign we've spotted with Skyworth Group .
If you're interested in investing in businesses that can grow profits without the burden of debt, then check out this free list of growing businesses that have net cash on the balance sheet.
New: Manage All Your Stock Portfolios in One Place
We've created the ultimate portfolio companion for stock investors, and it's free.
• Connect an unlimited number of Portfolios and see your total in one currency
• Be alerted to new Warning Signs or Risks via email or mobile
• Track the Fair Value of your stocks
Have feedback on this article? Concerned about the content? Get in touch with us directly. Alternatively, email editorial-team (at) simplywallst.com.
This article by Simply Wall St is general in nature. We provide commentary based on historical data and analyst forecasts only using an unbiased methodology and our articles are not intended to be financial advice. It does not constitute a recommendation to buy or sell any stock, and does not take account of your objectives, or your financial situation. We aim to bring you long-term focused analysis driven by fundamental data. Note that our analysis may not factor in the latest price-sensitive company announcements or qualitative material. Simply Wall St has no position in any stocks mentioned.
About SEHK:751
Skyworth Group
Researches, develops, manufactures, sells, and trades in consumer electronic products in Mainland China, Asia, Europe, the Americas, and Africa.
Excellent balance sheet and fair value.
Similar Companies
Market Insights

Advertisement
Weekly Picks
RO


RockeTeller on Santacruz Silver Mining ·
Crazy Undervalued 42 Baggers Silver Play (Active & Running Mine)
Fair Value:CA$8696.7% undervalued
14 followersusers have followed this narrative
5 commentsusers have commented on this narrative
1 likeusers have liked this narrative
RO


Robbo on Fiducian Group ·
Fiducian: Compliance Clouds or Value Opportunity?
Fair Value:AU$126.1% undervalued
2 followersusers have followed this narrative
0 commentsusers have commented on this narrative
0 likesusers have liked this narrative
WO

woodworthfund on Willamette Valley Vineyards ·
Willamette Valley Vineyards (WVVI): Not-So-Great Value
Fair Value:US$242.5% overvalued
2 followersusers have followed this narrative
0 commentsusers have commented on this narrative
1 likeusers have liked this narrative
Recently Updated Narratives
YE
Yellow_fever on China Starch Holdings ·
China Starch Holdings eyes a revenue growth of 4.66% with a 5-year strategic plan
Fair Value:HK$0.563.2% undervalued
1 followerusers have followed this narrative
0 commentsusers have commented on this narrative
0 likesusers have liked this narrative
CO

composite32 on Power Solutions International ·
PSIX The timing of insider sales is a serious question mark
Fair Value:US$37.3845.7% overvalued
1 followerusers have followed this narrative
0 commentsusers have commented on this narrative
0 likesusers have liked this narrative
TA


Talos on Marvell Technology ·
The Great Strategy Swap – Selling "Old Auto" to Buy "Future Light"
Fair Value:US$155.3740.2% undervalued
1 followerusers have followed this narrative
0 commentsusers have commented on this narrative
0 likesusers have liked this narrative
Popular Narratives
TH


TheWallstreetKing on MicroVision ·
MicroVision will explode future revenue by 380.37% with a vision towards success
Fair Value:US$6098.6% undervalued
112 followersusers have followed this narrative
11 commentsusers have commented on this narrative
22 likesusers have liked this narrative
AN


AnalystConsensusTarget on NVIDIA ·
NVDA: Expanding AI Demand Will Drive Major Data Center Investments Through 2026
Fair Value:US$250.3927.5% undervalued
947 followersusers have followed this narrative
6 commentsusers have commented on this narrative
24 likesusers have liked this narrative
OS


oscargarcia on Alphabet ·
The company that turned a verb into a global necessity and basically runs the modern internet, digital ads, smartphones, maps, and AI.
Fair Value:US$3407.1% undervalued
148 followersusers have followed this narrative
6 commentsusers have commented on this narrative
18 likesusers have liked this narrative

