
Advertisement
- Hong Kong
- /
- Consumer Durables
- /
- SEHK:531
Samson Holding Ltd. (HKG:531) Stock Rockets 28% As Investors Are Less Pessimistic Than Expected

Samson Holding Ltd. (HKG:531) shares have had a really impressive month, gaining 28% after a shaky period beforehand. Not all shareholders will be feeling jubilant, since the share price is still down a very disappointing 25% in the last twelve months.
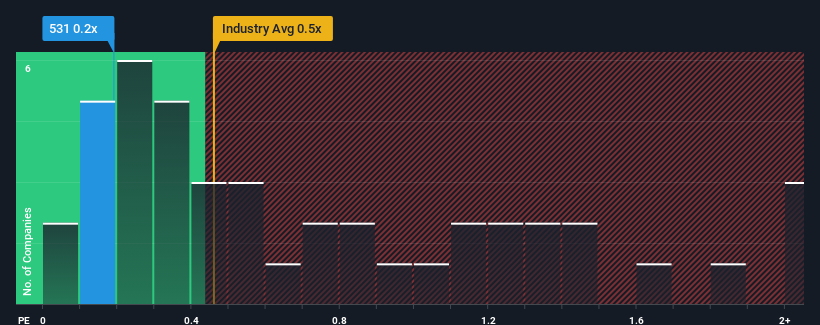
In spite of the firm bounce in price, it's still not a stretch to say that Samson Holding's price-to-sales (or "P/S") ratio of 0.2x right now seems quite "middle-of-the-road" compared to the Consumer Durables industry in Hong Kong, where the median P/S ratio is around 0.5x. While this might not raise any eyebrows, if the P/S ratio is not justified investors could be missing out on a potential opportunity or ignoring looming disappointment.
View our latest analysis for Samson Holding
What Does Samson Holding's Recent Performance Look Like?
As an illustration, revenue has deteriorated at Samson Holding over the last year, which is not ideal at all. It might be that many expect the company to put the disappointing revenue performance behind them over the coming period, which has kept the P/S from falling. If you like the company, you'd at least be hoping this is the case so that you could potentially pick up some stock while it's not quite in favour.
Although there are no analyst estimates available for Samson Holding, take a look at this free data-rich visualisation to see how the company stacks up on earnings, revenue and cash flow.Do Revenue Forecasts Match The P/S Ratio?
The only time you'd be comfortable seeing a P/S like Samson Holding's is when the company's growth is tracking the industry closely.
In reviewing the last year of financials, we were disheartened to see the company's revenues fell to the tune of 31%. At least revenue has managed not to go completely backwards from three years ago in aggregate, thanks to the earlier period of growth. Therefore, it's fair to say that revenue growth has been inconsistent recently for the company.
This is in contrast to the rest of the industry, which is expected to grow by 12% over the next year, materially higher than the company's recent medium-term annualised growth rates.
With this in mind, we find it intriguing that Samson Holding's P/S is comparable to that of its industry peers. Apparently many investors in the company are less bearish than recent times would indicate and aren't willing to let go of their stock right now. Maintaining these prices will be difficult to achieve as a continuation of recent revenue trends is likely to weigh down the shares eventually.
What Does Samson Holding's P/S Mean For Investors?
Its shares have lifted substantially and now Samson Holding's P/S is back within range of the industry median. While the price-to-sales ratio shouldn't be the defining factor in whether you buy a stock or not, it's quite a capable barometer of revenue expectations.
Our examination of Samson Holding revealed its poor three-year revenue trends aren't resulting in a lower P/S as per our expectations, given they look worse than current industry outlook. When we see weak revenue with slower than industry growth, we suspect the share price is at risk of declining, bringing the P/S back in line with expectations. Unless there is a significant improvement in the company's medium-term performance, it will be difficult to prevent the P/S ratio from declining to a more reasonable level.
We don't want to rain on the parade too much, but we did also find 3 warning signs for Samson Holding that you need to be mindful of.
It's important to make sure you look for a great company, not just the first idea you come across. So if growing profitability aligns with your idea of a great company, take a peek at this free list of interesting companies with strong recent earnings growth (and a low P/E).
New: Manage All Your Stock Portfolios in One Place
We've created the ultimate portfolio companion for stock investors, and it's free.
• Connect an unlimited number of Portfolios and see your total in one currency
• Be alerted to new Warning Signs or Risks via email or mobile
• Track the Fair Value of your stocks
Have feedback on this article? Concerned about the content? Get in touch with us directly. Alternatively, email editorial-team (at) simplywallst.com.
This article by Simply Wall St is general in nature. We provide commentary based on historical data and analyst forecasts only using an unbiased methodology and our articles are not intended to be financial advice. It does not constitute a recommendation to buy or sell any stock, and does not take account of your objectives, or your financial situation. We aim to bring you long-term focused analysis driven by fundamental data. Note that our analysis may not factor in the latest price-sensitive company announcements or qualitative material. Simply Wall St has no position in any stocks mentioned.
Have feedback on this article? Concerned about the content? Get in touch with us directly. Alternatively, email editorial-team@simplywallst.com
About SEHK:531
Samson Holding
An investment holding company, designs, manufactures, markets, trades in, and sells residential and commercial furniture in the People’s Republic of China, the United States, and internationally.
Excellent balance sheet and slightly overvalued.
Market Insights

Advertisement
Community Narratives

Apple: A Dying Star with an Overpriced Valuation
Fair Value US$177.34|19.1% overvalued
IN
Community Contributor
Avino a case for USD$20 per share within 5 years (assuming $3,500 gold, $100 silver and $4 copper).
Fair Value CA$26.79|86.0% undervalued
AG
Community Contributor
Riding the Defense Boom RENK Sees Revenue Climb at 15% CAGR by FY 2029
Fair Value €69.87|14.3% undervalued
CH
Community Contributor