
Advertisement
Optimistic Investors Push Texhong International Group Limited (HKG:2678) Shares Up 25% But Growth Is Lacking
Texhong International Group Limited (HKG:2678) shares have had a really impressive month, gaining 25% after a shaky period beforehand. Unfortunately, despite the strong performance over the last month, the full year gain of 3.5% isn't as attractive.
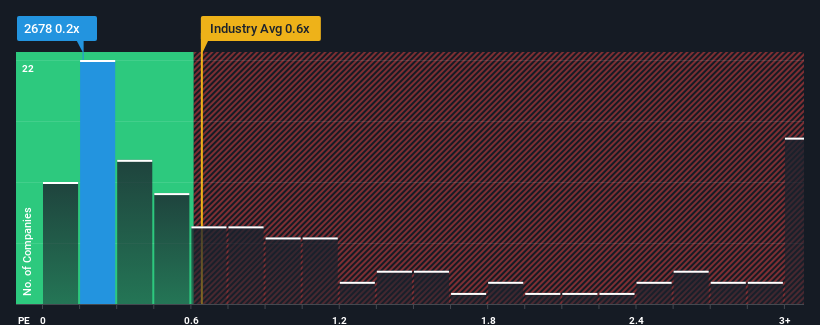
Although its price has surged higher, it's still not a stretch to say that Texhong International Group's price-to-sales (or "P/S") ratio of 0.2x right now seems quite "middle-of-the-road" compared to the Luxury industry in Hong Kong, where the median P/S ratio is around 0.6x. However, investors might be overlooking a clear opportunity or potential setback if there is no rational basis for the P/S.
See our latest analysis for Texhong International Group
How Has Texhong International Group Performed Recently?
Texhong International Group could be doing better as it's been growing revenue less than most other companies lately. One possibility is that the P/S ratio is moderate because investors think this lacklustre revenue performance will turn around. If not, then existing shareholders may be a little nervous about the viability of the share price.
If you'd like to see what analysts are forecasting going forward, you should check out our free report on Texhong International Group.Is There Some Revenue Growth Forecasted For Texhong International Group?
In order to justify its P/S ratio, Texhong International Group would need to produce growth that's similar to the industry.
Taking a look back first, we see that the company managed to grow revenues by a handy 7.4% last year. Ultimately though, it couldn't turn around the poor performance of the prior period, with revenue shrinking 3.0% in total over the last three years. So unfortunately, we have to acknowledge that the company has not done a great job of growing revenue over that time.
Looking ahead now, revenue is anticipated to climb by 6.1% during the coming year according to the dual analysts following the company. Meanwhile, the rest of the industry is forecast to expand by 12%, which is noticeably more attractive.
With this information, we find it interesting that Texhong International Group is trading at a fairly similar P/S compared to the industry. Apparently many investors in the company are less bearish than analysts indicate and aren't willing to let go of their stock right now. These shareholders may be setting themselves up for future disappointment if the P/S falls to levels more in line with the growth outlook.
The Final Word
Texhong International Group's stock has a lot of momentum behind it lately, which has brought its P/S level with the rest of the industry. Using the price-to-sales ratio alone to determine if you should sell your stock isn't sensible, however it can be a practical guide to the company's future prospects.
When you consider that Texhong International Group's revenue growth estimates are fairly muted compared to the broader industry, it's easy to see why we consider it unexpected to be trading at its current P/S ratio. When we see companies with a relatively weaker revenue outlook compared to the industry, we suspect the share price is at risk of declining, sending the moderate P/S lower. This places shareholders' investments at risk and potential investors in danger of paying an unnecessary premium.
There are also other vital risk factors to consider before investing and we've discovered 2 warning signs for Texhong International Group that you should be aware of.
It's important to make sure you look for a great company, not just the first idea you come across. So if growing profitability aligns with your idea of a great company, take a peek at this free list of interesting companies with strong recent earnings growth (and a low P/E).
Valuation is complex, but we're here to simplify it.
Discover if Texhong International Group might be undervalued or overvalued with our detailed analysis, featuring fair value estimates, potential risks, dividends, insider trades, and its financial condition.
Access Free AnalysisHave feedback on this article? Concerned about the content? Get in touch with us directly. Alternatively, email editorial-team (at) simplywallst.com.
This article by Simply Wall St is general in nature. We provide commentary based on historical data and analyst forecasts only using an unbiased methodology and our articles are not intended to be financial advice. It does not constitute a recommendation to buy or sell any stock, and does not take account of your objectives, or your financial situation. We aim to bring you long-term focused analysis driven by fundamental data. Note that our analysis may not factor in the latest price-sensitive company announcements or qualitative material. Simply Wall St has no position in any stocks mentioned.
About SEHK:2678
Texhong International Group
An investment holding company, primarily manufactures and sells yarns, grey fabrics, and non-woven and garment fabrics.
Undervalued with excellent balance sheet.
Market Insights

Advertisement
Community Narratives
America Wants Homegrown Drones — Draganfly Is Ready to Deliver
Fair Value US$9.21|33.8% undervalued
JO
Community Contributor
Cheesecake Factory offers an enticing opportunity for long-term growth by leveraging new concepts
Fair Value US$73.83|26.3% undervalued
ZW
Community Contributor
Coca-Cola’s Intrinsic Value Set to Rise with Fed Rate Cut
Fair Value US$67.50|1.2% undervalued
AL
Community Contributor
Fully Permitted Gold Mine with 50 Baggers Potential 
Fair Value CA$41.00|98.6% undervalued
RO
Community Contributor