
Advertisement
There's Reason For Concern Over Prada S.p.A.'s (HKG:1913) Price

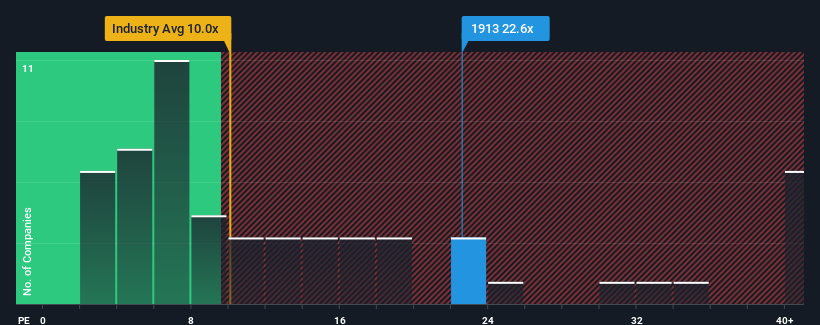
Prada S.p.A.'s (HKG:1913) price-to-earnings (or "P/E") ratio of 22.6x might make it look like a strong sell right now compared to the market in Hong Kong, where around half of the companies have P/E ratios below 9x and even P/E's below 5x are quite common. Nonetheless, we'd need to dig a little deeper to determine if there is a rational basis for the highly elevated P/E.
Recent times have been advantageous for Prada as its earnings have been rising faster than most other companies. The P/E is probably high because investors think this strong earnings performance will continue. If not, then existing shareholders might be a little nervous about the viability of the share price.
See our latest analysis for Prada
What Are Growth Metrics Telling Us About The High P/E?
The only time you'd be truly comfortable seeing a P/E as steep as Prada's is when the company's growth is on track to outshine the market decidedly.
Retrospectively, the last year delivered an exceptional 29% gain to the company's bottom line. Pleasingly, EPS has also lifted 235% in aggregate from three years ago, thanks to the last 12 months of growth. So we can start by confirming that the company has done a great job of growing earnings over that time.
Shifting to the future, estimates from the analysts covering the company suggest earnings should grow by 11% each year over the next three years. That's shaping up to be materially lower than the 15% each year growth forecast for the broader market.
In light of this, it's alarming that Prada's P/E sits above the majority of other companies. Apparently many investors in the company are way more bullish than analysts indicate and aren't willing to let go of their stock at any price. Only the boldest would assume these prices are sustainable as this level of earnings growth is likely to weigh heavily on the share price eventually.
The Key Takeaway
Using the price-to-earnings ratio alone to determine if you should sell your stock isn't sensible, however it can be a practical guide to the company's future prospects.
We've established that Prada currently trades on a much higher than expected P/E since its forecast growth is lower than the wider market. When we see a weak earnings outlook with slower than market growth, we suspect the share price is at risk of declining, sending the high P/E lower. Unless these conditions improve markedly, it's very challenging to accept these prices as being reasonable.
A lot of potential risks can sit within a company's balance sheet. You can assess many of the main risks through our free balance sheet analysis for Prada with six simple checks.
You might be able to find a better investment than Prada. If you want a selection of possible candidates, check out this free list of interesting companies that trade on a low P/E (but have proven they can grow earnings).
New: Manage All Your Stock Portfolios in One Place
We've created the ultimate portfolio companion for stock investors, and it's free.
• Connect an unlimited number of Portfolios and see your total in one currency
• Be alerted to new Warning Signs or Risks via email or mobile
• Track the Fair Value of your stocks
Have feedback on this article? Concerned about the content? Get in touch with us directly. Alternatively, email editorial-team (at) simplywallst.com.
This article by Simply Wall St is general in nature. We provide commentary based on historical data and analyst forecasts only using an unbiased methodology and our articles are not intended to be financial advice. It does not constitute a recommendation to buy or sell any stock, and does not take account of your objectives, or your financial situation. We aim to bring you long-term focused analysis driven by fundamental data. Note that our analysis may not factor in the latest price-sensitive company announcements or qualitative material. Simply Wall St has no position in any stocks mentioned.
About SEHK:1913
Prada
Produces and distributes leather goods, footwear, and ready to wear products worldwide.
Flawless balance sheet, good value and pays a dividend.
Market Insights


Advertisement
Community Narratives
Pole position to benefit from GENIUS Act
Fair Value US$233.04|58.8% undervalued
CH
Community Contributor
IREN will transform from bitcoin miner to leader in AI infrastructure
Fair Value US$21.48|17.5% undervalued
KA
Community Contributor
Behind the Assay: XRF Scientific’s Role in Modern Mining Economics
Fair Value AU$2.10|2.4% undervalued
RO
Community Contributor