Prada S.p.A.'s (HKG:1913) Price Is Out Of Tune With Earnings


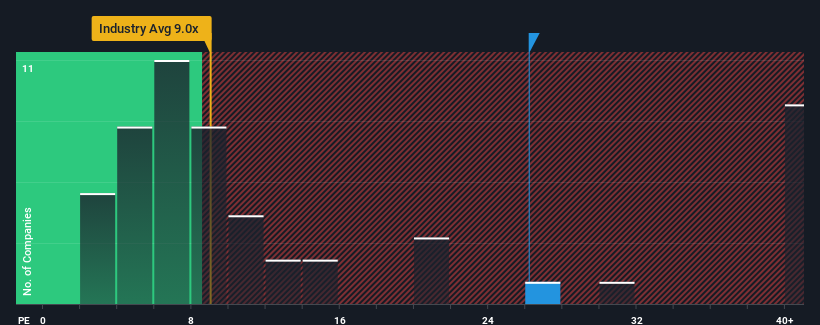
With a price-to-earnings (or "P/E") ratio of 26.2x Prada S.p.A. (HKG:1913) may be sending very bearish signals at the moment, given that almost half of all companies in Hong Kong have P/E ratios under 8x and even P/E's lower than 4x are not unusual. However, the P/E might be quite high for a reason and it requires further investigation to determine if it's justified.
With its earnings growth in positive territory compared to the declining earnings of most other companies, Prada has been doing quite well of late. It seems that many are expecting the company to continue defying the broader market adversity, which has increased investors’ willingness to pay up for the stock. You'd really hope so, otherwise you're paying a pretty hefty price for no particular reason.
Check out our latest analysis for Prada
How Is Prada's Growth Trending?
The only time you'd be truly comfortable seeing a P/E as steep as Prada's is when the company's growth is on track to outshine the market decidedly.
If we review the last year of earnings growth, the company posted a terrific increase of 51%. However, the latest three year period hasn't been as great in aggregate as it didn't manage to provide any growth at all. Accordingly, shareholders probably wouldn't have been overly satisfied with the unstable medium-term growth rates.
Looking ahead now, EPS is anticipated to climb by 15% per year during the coming three years according to the analysts following the company. Meanwhile, the rest of the market is forecast to expand by 15% each year, which is not materially different.
In light of this, it's curious that Prada's P/E sits above the majority of other companies. It seems most investors are ignoring the fairly average growth expectations and are willing to pay up for exposure to the stock. Although, additional gains will be difficult to achieve as this level of earnings growth is likely to weigh down the share price eventually.
The Bottom Line On Prada's P/E
Generally, our preference is to limit the use of the price-to-earnings ratio to establishing what the market thinks about the overall health of a company.
Our examination of Prada's analyst forecasts revealed that its market-matching earnings outlook isn't impacting its high P/E as much as we would have predicted. Right now we are uncomfortable with the relatively high share price as the predicted future earnings aren't likely to support such positive sentiment for long. Unless these conditions improve, it's challenging to accept these prices as being reasonable.
The company's balance sheet is another key area for risk analysis. Our free balance sheet analysis for Prada with six simple checks will allow you to discover any risks that could be an issue.
Of course, you might find a fantastic investment by looking at a few good candidates. So take a peek at this free list of companies with a strong growth track record, trading on a low P/E.
New: Manage All Your Stock Portfolios in One Place
We've created the ultimate portfolio companion for stock investors, and it's free.
• Connect an unlimited number of Portfolios and see your total in one currency
• Be alerted to new Warning Signs or Risks via email or mobile
• Track the Fair Value of your stocks
Have feedback on this article? Concerned about the content? Get in touch with us directly. Alternatively, email editorial-team (at) simplywallst.com.
This article by Simply Wall St is general in nature. We provide commentary based on historical data and analyst forecasts only using an unbiased methodology and our articles are not intended to be financial advice. It does not constitute a recommendation to buy or sell any stock, and does not take account of your objectives, or your financial situation. We aim to bring you long-term focused analysis driven by fundamental data. Note that our analysis may not factor in the latest price-sensitive company announcements or qualitative material. Simply Wall St has no position in any stocks mentioned.
About SEHK:1913
Prada
Designs, produces, and distributes leather goods, footwear, and ready to wear products worldwide.
Excellent balance sheet with proven track record.
Similar Companies
Market Insights

Community Narratives


