
Advertisement
C.banner International Holdings (HKG:1028) Could Be At Risk Of Shrinking As A Company

To avoid investing in a business that's in decline, there's a few financial metrics that can provide early indications of aging. More often than not, we'll see a declining return on capital employed (ROCE) and a declining amount of capital employed. This combination can tell you that not only is the company investing less, it's earning less on what it does invest. Having said that, after a brief look, C.banner International Holdings (HKG:1028) we aren't filled with optimism, but let's investigate further.
Understanding Return On Capital Employed (ROCE)
Just to clarify if you're unsure, ROCE is a metric for evaluating how much pre-tax income (in percentage terms) a company earns on the capital invested in its business. Analysts use this formula to calculate it for C.banner International Holdings:
Return on Capital Employed = Earnings Before Interest and Tax (EBIT) ÷ (Total Assets - Current Liabilities)
0.0017 = CN¥2.4m ÷ (CN¥1.8b - CN¥323m) (Based on the trailing twelve months to June 2023).
So, C.banner International Holdings has an ROCE of 0.2%. Ultimately, that's a low return and it under-performs the Luxury industry average of 11%.
Check out our latest analysis for C.banner International Holdings
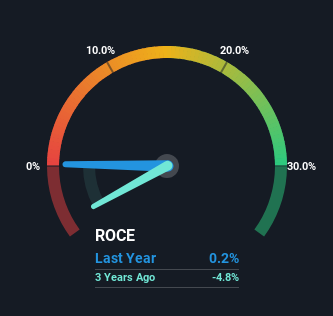
Historical performance is a great place to start when researching a stock so above you can see the gauge for C.banner International Holdings' ROCE against it's prior returns. If you're interested in investigating C.banner International Holdings' past further, check out this free graph of past earnings, revenue and cash flow.
The Trend Of ROCE
The trend of returns that C.banner International Holdings is generating are raising some concerns. The company used to generate 0.6% on its capital five years ago but it has since fallen noticeably. In addition to that, C.banner International Holdings is now employing 38% less capital than it was five years ago. The combination of lower ROCE and less capital employed can indicate that a business is likely to be facing some competitive headwinds or seeing an erosion to its moat. If these underlying trends continue, we wouldn't be too optimistic going forward.
On a side note, C.banner International Holdings has done well to pay down its current liabilities to 18% of total assets. So we could link some of this to the decrease in ROCE. Effectively this means their suppliers or short-term creditors are funding less of the business, which reduces some elements of risk. Some would claim this reduces the business' efficiency at generating ROCE since it is now funding more of the operations with its own money.
The Bottom Line On C.banner International Holdings' ROCE
In short, lower returns and decreasing amounts capital employed in the business doesn't fill us with confidence. It should come as no surprise then that the stock has fallen 69% over the last five years, so it looks like investors are recognizing these changes. Unless there is a shift to a more positive trajectory in these metrics, we would look elsewhere.
C.banner International Holdings does have some risks though, and we've spotted 3 warning signs for C.banner International Holdings that you might be interested in.
While C.banner International Holdings isn't earning the highest return, check out this free list of companies that are earning high returns on equity with solid balance sheets.
New: AI Stock Screener & Alerts
Our new AI Stock Screener scans the market every day to uncover opportunities.
• Dividend Powerhouses (3%+ Yield)
• Undervalued Small Caps with Insider Buying
• High growth Tech and AI Companies
Or build your own from over 50 metrics.
Have feedback on this article? Concerned about the content? Get in touch with us directly. Alternatively, email editorial-team (at) simplywallst.com.
This article by Simply Wall St is general in nature. We provide commentary based on historical data and analyst forecasts only using an unbiased methodology and our articles are not intended to be financial advice. It does not constitute a recommendation to buy or sell any stock, and does not take account of your objectives, or your financial situation. We aim to bring you long-term focused analysis driven by fundamental data. Note that our analysis may not factor in the latest price-sensitive company announcements or qualitative material. Simply Wall St has no position in any stocks mentioned.
About SEHK:1028
C.banner International Holdings
An investment holding company, produces, sells, and retails women’s formal and casual footwear primarily in the People’s Republic of China and the United States.
Flawless balance sheet with questionable track record.
Market Insights


Advertisement
Community Narratives
Nike's Direct-to-Consumer Focus Will Drive Future Growth
Fair Value US$87.90|18.2% undervalued
UN
Community Contributor
Novo Nordisk will dominate GLP-1 market with Ozempic and Wegovy growth
Fair Value US$89.59|12.1% undervalued
BE
Community Contributor
Rheinmetall could get 20-25% of EU-NATO 3%-GDP defence spending
Fair Value €7.57k|82.8% undervalued
NO
Community Contributor