
Advertisement
- Hong Kong
- /
- Professional Services
- /
- SEHK:8293
The Market Lifts SingAsia Holdings Limited (HKG:8293) Shares 37% But It Can Do More

The SingAsia Holdings Limited (HKG:8293) share price has done very well over the last month, posting an excellent gain of 37%. But the last month did very little to improve the 69% share price decline over the last year.
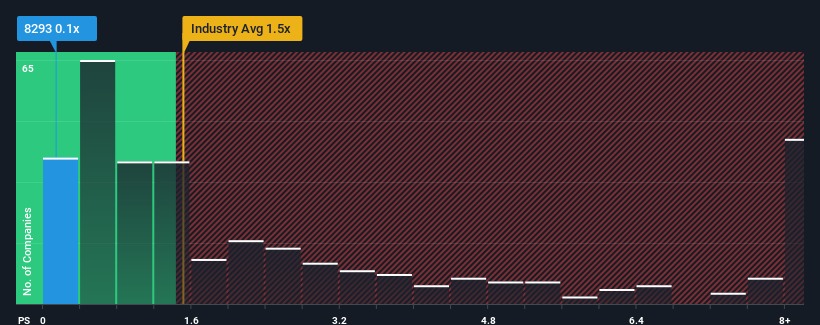
Although its price has surged higher, you could still be forgiven for feeling indifferent about SingAsia Holdings' P/S ratio of 0.1x, since the median price-to-sales (or "P/S") ratio for the Professional Services industry in Hong Kong is also close to 0.6x. However, investors might be overlooking a clear opportunity or potential setback if there is no rational basis for the P/S.
View our latest analysis for SingAsia Holdings
What Does SingAsia Holdings' Recent Performance Look Like?
For example, consider that SingAsia Holdings' financial performance has been pretty ordinary lately as revenue growth is non-existent. It might be that many expect the uninspiring revenue performance to only match most other companies at best over the coming period, which has kept the P/S from rising. Those who are bullish on SingAsia Holdings will be hoping that this isn't the case, so that they can pick up the stock at a lower valuation.
Want the full picture on earnings, revenue and cash flow for the company? Then our free report on SingAsia Holdings will help you shine a light on its historical performance.How Is SingAsia Holdings' Revenue Growth Trending?
The only time you'd be comfortable seeing a P/S like SingAsia Holdings' is when the company's growth is tracking the industry closely.
Taking a look back first, we see that there was hardly any revenue growth to speak of for the company over the past year. However, a few strong years before that means that it was still able to grow revenue by an impressive 130% in total over the last three years. Accordingly, shareholders will be pleased, but also have some questions to ponder about the last 12 months.
When compared to the industry's one-year growth forecast of 12%, the most recent medium-term revenue trajectory is noticeably more alluring
With this information, we find it interesting that SingAsia Holdings is trading at a fairly similar P/S compared to the industry. It may be that most investors are not convinced the company can maintain its recent growth rates.
The Key Takeaway
Its shares have lifted substantially and now SingAsia Holdings' P/S is back within range of the industry median. Typically, we'd caution against reading too much into price-to-sales ratios when settling on investment decisions, though it can reveal plenty about what other market participants think about the company.
We didn't quite envision SingAsia Holdings' P/S sitting in line with the wider industry, considering the revenue growth over the last three-year is higher than the current industry outlook. There could be some unobserved threats to revenue preventing the P/S ratio from matching this positive performance. It appears some are indeed anticipating revenue instability, because the persistence of these recent medium-term conditions would normally provide a boost to the share price.
You need to take note of risks, for example - SingAsia Holdings has 2 warning signs (and 1 which is a bit concerning) we think you should know about.
If companies with solid past earnings growth is up your alley, you may wish to see this free collection of other companies with strong earnings growth and low P/E ratios.
New: Manage All Your Stock Portfolios in One Place
We've created the ultimate portfolio companion for stock investors, and it's free.
• Connect an unlimited number of Portfolios and see your total in one currency
• Be alerted to new Warning Signs or Risks via email or mobile
• Track the Fair Value of your stocks
Have feedback on this article? Concerned about the content? Get in touch with us directly. Alternatively, email editorial-team (at) simplywallst.com.
This article by Simply Wall St is general in nature. We provide commentary based on historical data and analyst forecasts only using an unbiased methodology and our articles are not intended to be financial advice. It does not constitute a recommendation to buy or sell any stock, and does not take account of your objectives, or your financial situation. We aim to bring you long-term focused analysis driven by fundamental data. Note that our analysis may not factor in the latest price-sensitive company announcements or qualitative material. Simply Wall St has no position in any stocks mentioned.
About SEHK:8293
SingAsia Holdings
An investment holding company, provides workforce solutions in Singapore.
Slight with mediocre balance sheet.
Market Insights

Advertisement
Community Narratives
Scaling up in building materials with smart M&A and growing profitability
Fair Value US$2.77|30.0% undervalued
CM
Community Contributor
Hims: The Platform Powering Personalised Healthcare
Fair Value US$114.01|51.9% undervalued
BL
Community Contributor
Undervalued lottery company with strong fundamentals
Fair Value AU$15.00|34.5% undervalued
RO
Community Contributor
Proximus, transferring money from the impatient to the patient investor
Fair Value €16.62|55.1% undervalued
AX
Community Contributor