
Advertisement
- Hong Kong
- /
- Professional Services
- /
- SEHK:6113
Here's What To Make Of UTS Marketing Solutions Holdings' (HKG:6113) Decelerating Rates Of Return
Did you know there are some financial metrics that can provide clues of a potential multi-bagger? Amongst other things, we'll want to see two things; firstly, a growing return on capital employed (ROCE) and secondly, an expansion in the company's amount of capital employed. Basically this means that a company has profitable initiatives that it can continue to reinvest in, which is a trait of a compounding machine. In light of that, when we looked at UTS Marketing Solutions Holdings (HKG:6113) and its ROCE trend, we weren't exactly thrilled.
Return On Capital Employed (ROCE): What Is It?
For those who don't know, ROCE is a measure of a company's yearly pre-tax profit (its return), relative to the capital employed in the business. Analysts use this formula to calculate it for UTS Marketing Solutions Holdings:
Return on Capital Employed = Earnings Before Interest and Tax (EBIT) ÷ (Total Assets - Current Liabilities)
0.14 = RM8.2m ÷ (RM71m - RM13m) (Based on the trailing twelve months to June 2023).
Thus, UTS Marketing Solutions Holdings has an ROCE of 14%. In absolute terms, that's a satisfactory return, but compared to the Professional Services industry average of 12% it's much better.
View our latest analysis for UTS Marketing Solutions Holdings
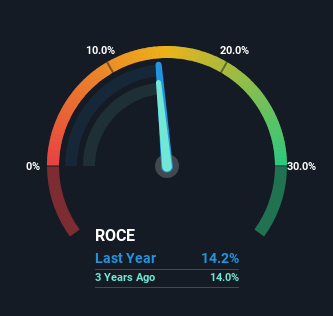
While the past is not representative of the future, it can be helpful to know how a company has performed historically, which is why we have this chart above. If you want to delve into the historical earnings, revenue and cash flow of UTS Marketing Solutions Holdings, check out these free graphs here.
The Trend Of ROCE
We've noticed that although returns on capital are flat over the last five years, the amount of capital employed in the business has fallen 36% in that same period. To us that doesn't look like a multi-bagger because the company appears to be selling assets and it's returns aren't increasing. So if this trend continues, don't be surprised if the business is smaller in a few years time.
On another note, while the change in ROCE trend might not scream for attention, it's interesting that the current liabilities have actually gone up over the last five years. This is intriguing because if current liabilities hadn't increased to 18% of total assets, this reported ROCE would probably be less than14% because total capital employed would be higher.The 14% ROCE could be even lower if current liabilities weren't 18% of total assets, because the the formula would show a larger base of total capital employed. So while current liabilities isn't high right now, keep an eye out in case it increases further, because this can introduce some elements of risk.
In Conclusion...
Overall, we're not ecstatic to see UTS Marketing Solutions Holdings reducing the amount of capital it employs in the business. And with the stock having returned a mere 16% in the last five years to shareholders, you could argue that they're aware of these lackluster trends. So if you're looking for a multi-bagger, the underlying trends indicate you may have better chances elsewhere.
UTS Marketing Solutions Holdings does have some risks, we noticed 5 warning signs (and 1 which is a bit unpleasant) we think you should know about.
If you want to search for solid companies with great earnings, check out this free list of companies with good balance sheets and impressive returns on equity.
Valuation is complex, but we're here to simplify it.
Discover if BitStrat Holdings might be undervalued or overvalued with our detailed analysis, featuring fair value estimates, potential risks, dividends, insider trades, and its financial condition.
Access Free AnalysisHave feedback on this article? Concerned about the content? Get in touch with us directly. Alternatively, email editorial-team (at) simplywallst.com.
This article by Simply Wall St is general in nature. We provide commentary based on historical data and analyst forecasts only using an unbiased methodology and our articles are not intended to be financial advice. It does not constitute a recommendation to buy or sell any stock, and does not take account of your objectives, or your financial situation. We aim to bring you long-term focused analysis driven by fundamental data. Note that our analysis may not factor in the latest price-sensitive company announcements or qualitative material. Simply Wall St has no position in any stocks mentioned.
About SEHK:6113
BitStrat Holdings
An investment holding company, provides outbound telemarketing services and contact center facilities in Malaysia.
Excellent balance sheet with questionable track record.
Market Insights

Advertisement
Community Narratives
The company that turned a verb into a global necessity and basically runs the modern internet, digital ads, smartphones, maps, and AI.
Fair Value US$300.00|6.2% undervalued
OS
Community Contributor
Flowers Foods Pays A Fair Price For Health
Fair Value US$16.12|25.1% undervalued
NV
Community Contributor
TMX Group will thrive with 33.3% profit margin and enduring market moat
Fair Value CA$49.90|0.04% overvalued
LI
Community Contributor