- Hong Kong
- /
- Electrical
- /
- SEHK:8132
Investors Give Century Energy International Holdings Limited (HKG:8132) Shares A 26% Hiding


Century Energy International Holdings Limited (HKG:8132) shareholders won't be pleased to see that the share price has had a very rough month, dropping 26% and undoing the prior period's positive performance. Instead of being rewarded, shareholders who have already held through the last twelve months are now sitting on a 34% share price drop.
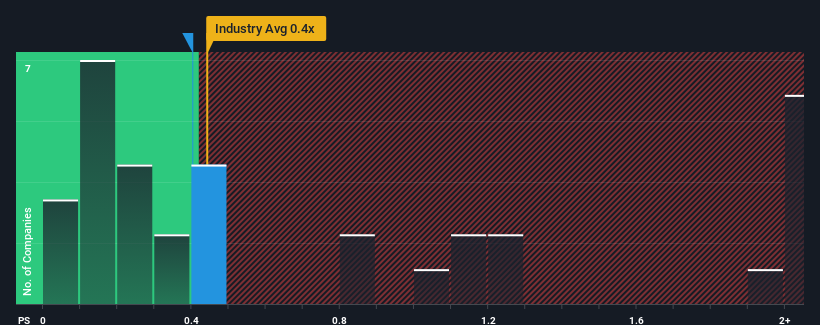
Even after such a large drop in price, it's still not a stretch to say that Century Energy International Holdings' price-to-sales (or "P/S") ratio of 0.4x right now seems quite "middle-of-the-road" compared to the Electrical industry in Hong Kong, seeing as it matches the P/S ratio of the wider industry. However, investors might be overlooking a clear opportunity or potential setback if there is no rational basis for the P/S.
Check out our latest analysis for Century Energy International Holdings
How Century Energy International Holdings Has Been Performing
Century Energy International Holdings certainly has been doing a great job lately as it's been growing its revenue at a really rapid pace. It might be that many expect the strong revenue performance to wane, which has kept the share price, and thus the P/S ratio, from rising. If you like the company, you'd be hoping this isn't the case so that you could potentially pick up some stock while it's not quite in favour.
We don't have analyst forecasts, but you can see how recent trends are setting up the company for the future by checking out our free report on Century Energy International Holdings' earnings, revenue and cash flow.How Is Century Energy International Holdings' Revenue Growth Trending?
In order to justify its P/S ratio, Century Energy International Holdings would need to produce growth that's similar to the industry.
Taking a look back first, we see that the company's revenues underwent some rampant growth over the last 12 months. Spectacularly, three year revenue growth has also set the world alight, thanks to the last 12 months of incredible growth. So we can start by confirming that the company has done a tremendous job of growing revenue over that time.
Comparing that recent medium-term revenue trajectory with the industry's one-year growth forecast of 25% shows it's noticeably more attractive.
In light of this, it's curious that Century Energy International Holdings' P/S sits in line with the majority of other companies. Apparently some shareholders believe the recent performance is at its limits and have been accepting lower selling prices.
The Final Word
With its share price dropping off a cliff, the P/S for Century Energy International Holdings looks to be in line with the rest of the Electrical industry. Typically, we'd caution against reading too much into price-to-sales ratios when settling on investment decisions, though it can reveal plenty about what other market participants think about the company.
We've established that Century Energy International Holdings currently trades on a lower than expected P/S since its recent three-year growth is higher than the wider industry forecast. It'd be fair to assume that potential risks the company faces could be the contributing factor to the lower than expected P/S. While recent revenue trends over the past medium-term suggest that the risk of a price decline is low, investors appear to see the likelihood of revenue fluctuations in the future.
We don't want to rain on the parade too much, but we did also find 3 warning signs for Century Energy International Holdings (1 shouldn't be ignored!) that you need to be mindful of.
If companies with solid past earnings growth is up your alley, you may wish to see this free collection of other companies with strong earnings growth and low P/E ratios.
If you're looking to trade Century Energy International Holdings, open an account with the lowest-cost platform trusted by professionals, Interactive Brokers.
With clients in over 200 countries and territories, and access to 160 markets, IBKR lets you trade stocks, options, futures, forex, bonds and funds from a single integrated account.
Enjoy no hidden fees, no account minimums, and FX conversion rates as low as 0.03%, far better than what most brokers offer.
Sponsored ContentNew: AI Stock Screener & Alerts
Our new AI Stock Screener scans the market every day to uncover opportunities.
• Dividend Powerhouses (3%+ Yield)
• Undervalued Small Caps with Insider Buying
• High growth Tech and AI Companies
Or build your own from over 50 metrics.
Have feedback on this article? Concerned about the content? Get in touch with us directly. Alternatively, email editorial-team (at) simplywallst.com.
This article by Simply Wall St is general in nature. We provide commentary based on historical data and analyst forecasts only using an unbiased methodology and our articles are not intended to be financial advice. It does not constitute a recommendation to buy or sell any stock, and does not take account of your objectives, or your financial situation. We aim to bring you long-term focused analysis driven by fundamental data. Note that our analysis may not factor in the latest price-sensitive company announcements or qualitative material. Simply Wall St has no position in any stocks mentioned.
About SEHK:8132
Century Energy International Holdings
An investment holding company, refined oil and chemicals trading, and power and data cords manufacturing and trading businesses in Hong Kong, the People’s Republic of China, Taiwan, the United States, and internationally.
Low and slightly overvalued.
Market Insights

Community Narratives


