- Hong Kong
- /
- Trade Distributors
- /
- SEHK:8080
Will The ROCE Trend At North Asia Strategic Holdings (HKG:8080) Continue?


To find a multi-bagger stock, what are the underlying trends we should look for in a business? Firstly, we'll want to see a proven return on capital employed (ROCE) that is increasing, and secondly, an expanding base of capital employed. This shows us that it's a compounding machine, able to continually reinvest its earnings back into the business and generate higher returns. With that in mind, we've noticed some promising trends at North Asia Strategic Holdings (HKG:8080) so let's look a bit deeper.
Return On Capital Employed (ROCE): What is it?
Just to clarify if you're unsure, ROCE is a metric for evaluating how much pre-tax income (in percentage terms) a company earns on the capital invested in its business. To calculate this metric for North Asia Strategic Holdings, this is the formula:
Return on Capital Employed = Earnings Before Interest and Tax (EBIT) ÷ (Total Assets - Current Liabilities)
0.14 = HK$170m ÷ (HK$3.2b - HK$2.0b) (Based on the trailing twelve months to December 2020).
So, North Asia Strategic Holdings has an ROCE of 14%. In absolute terms, that's a satisfactory return, but compared to the Trade Distributors industry average of 4.1% it's much better.
View our latest analysis for North Asia Strategic Holdings
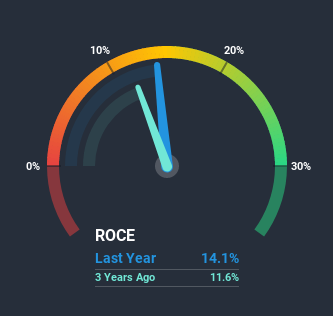
While the past is not representative of the future, it can be helpful to know how a company has performed historically, which is why we have this chart above. If you'd like to look at how North Asia Strategic Holdings has performed in the past in other metrics, you can view this free graph of past earnings, revenue and cash flow.
What Can We Tell From North Asia Strategic Holdings' ROCE Trend?
North Asia Strategic Holdings is displaying some positive trends. Over the last five years, returns on capital employed have risen substantially to 14%. The company is effectively making more money per dollar of capital used, and it's worth noting that the amount of capital has increased too, by 35%. This can indicate that there's plenty of opportunities to invest capital internally and at ever higher rates, a combination that's common among multi-baggers.
For the record though, there was a noticeable increase in the company's current liabilities over the period, so we would attribute some of the ROCE growth to that. Essentially the business now has suppliers or short-term creditors funding about 63% of its operations, which isn't ideal. Given it's pretty high ratio, we'd remind investors that having current liabilities at those levels can bring about some risks in certain businesses.
What We Can Learn From North Asia Strategic Holdings' ROCE
A company that is growing its returns on capital and can consistently reinvest in itself is a highly sought after trait, and that's what North Asia Strategic Holdings has. And with a respectable 61% awarded to those who held the stock over the last five years, you could argue that these developments are starting to get the attention they deserve. Therefore, we think it would be worth your time to check if these trends are going to continue.
On a final note, we've found 2 warning signs for North Asia Strategic Holdings that we think you should be aware of.
For those who like to invest in solid companies, check out this free list of companies with solid balance sheets and high returns on equity.
When trading North Asia Strategic Holdings or any other investment, use the platform considered by many to be the Professional's Gateway to the Worlds Market, Interactive Brokers. You get the lowest-cost* trading on stocks, options, futures, forex, bonds and funds worldwide from a single integrated account. Promoted
If you're looking to trade North Asia Strategic Holdings, open an account with the lowest-cost platform trusted by professionals, Interactive Brokers.
With clients in over 200 countries and territories, and access to 160 markets, IBKR lets you trade stocks, options, futures, forex, bonds and funds from a single integrated account.
Enjoy no hidden fees, no account minimums, and FX conversion rates as low as 0.03%, far better than what most brokers offer.
Sponsored ContentValuation is complex, but we're here to simplify it.
Discover if North Asia Strategic Holdings might be undervalued or overvalued with our detailed analysis, featuring fair value estimates, potential risks, dividends, insider trades, and its financial condition.
Access Free AnalysisThis article by Simply Wall St is general in nature. It does not constitute a recommendation to buy or sell any stock, and does not take account of your objectives, or your financial situation. We aim to bring you long-term focused analysis driven by fundamental data. Note that our analysis may not factor in the latest price-sensitive company announcements or qualitative material. Simply Wall St has no position in any stocks mentioned.
*Interactive Brokers Rated Lowest Cost Broker by StockBrokers.com Annual Online Review 2020
Have feedback on this article? Concerned about the content? Get in touch with us directly. Alternatively, email editorial-team (at) simplywallst.com.
About SEHK:8080
North Asia Strategic Holdings
An investment holding company, engages in the hi-tech distribution and services, electronic payment solution, and leasing businesses in Hong Kong, the People’s Republic of China, and rest of Asia.
Adequate balance sheet and slightly overvalued.
Market Insights

Community Narratives


