Should You Rethink Techtronic Industries After Sharp 18.6% Drop Despite Resilient Fundamentals?

Reviewed by Bailey Pemberton
If you're following Techtronic Industries, you might feel a little conflicted right now. The stock's recent journey hasn't been smooth. In the past year alone, it's dropped by 18.6%, and year-to-date it's still trailing, down 6.3%. Even the past week saw a 4.2% slip. But not everything is doom and gloom. If we zoom out, that three-year return is a strong 32.6%, showing the underlying business hasn't lost its footing entirely.
So what's behind these swings? Investors have been adjusting their views, partly in response to shifting sentiment around global supply chain resilience and the evolving demand for home improvement tools, sectors in which Techtronic remains a major player. While the broader market has wobbled on concerns about consumer spending and manufacturing costs, some see Techtronic’s recent declines as a temporary reaction rather than a structural red flag.
As for valuation, Techtronic Industries earns a value score of 3 out of 6 based on key checks, meaning it's considered undervalued in half of the measures analysts use to sniff out bargain opportunities. But what does that really mean for you as an investor?
Let’s roll up our sleeves and dig into the different methods used to value the company. Along the way, we’ll not only review those checks, but explore what might be the smartest, most practical approach for understanding whether Techtronic Industries truly deserves a spot in your portfolio.
Why Techtronic Industries is lagging behind its peers
Approach 1: Techtronic Industries Discounted Cash Flow (DCF) Analysis
The Discounted Cash Flow (DCF) model is designed to estimate a company's intrinsic value by projecting its future cash flows and discounting them back to today's value. This gives investors a snapshot of what the company could truly be worth based on cash it is expected to generate in years to come.
For Techtronic Industries, the latest reported Free Cash Flow stands at approximately $1.36 billion. Analyst estimates suggest that by 2027, annual Free Cash Flow could reach $1.92 billion. Looking even further out, extrapolated forecasts put Free Cash Flow near $2.67 billion by 2035. These projections are generated using a two-stage Free Cash Flow to Equity approach, with the initial years based on direct analyst estimates and the longer-term outlook extended by Simply Wall St.
After applying the DCF methodology, the estimated intrinsic value per share for Techtronic Industries is $152.47. This implies the stock is trading at a significant discount, specifically 38.2% below its calculated fair value. In other words, investors buying at today’s prices are getting more value for each dollar invested than the model suggests is warranted by future cash flow potential.
Result: UNDERVALUED
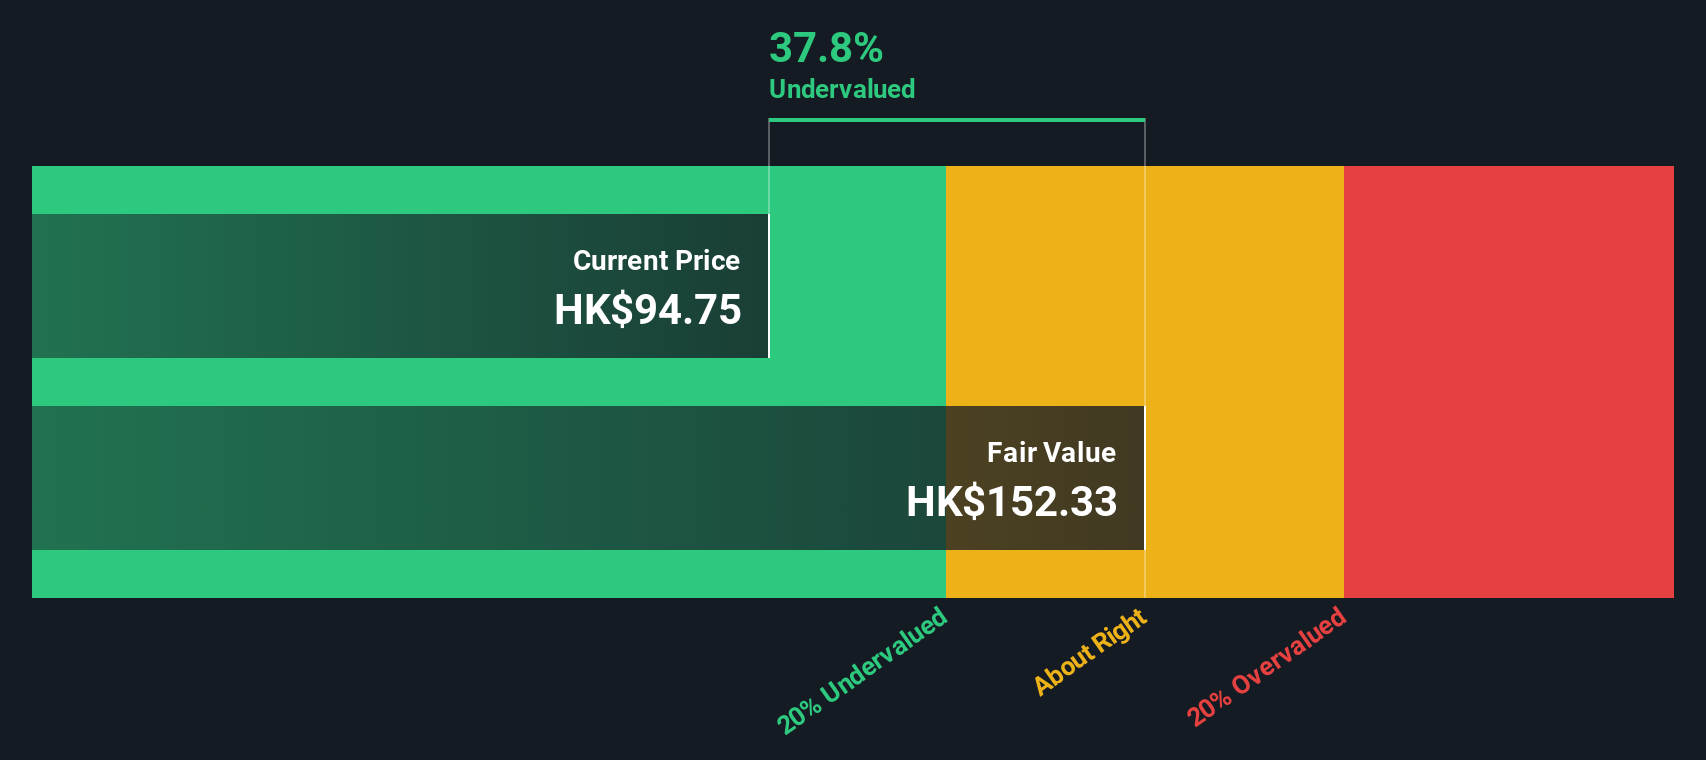
Our Discounted Cash Flow (DCF) analysis suggests Techtronic Industries is undervalued by 38.2%. Track this in your watchlist or portfolio, or discover more undervalued stocks.
Approach 2: Techtronic Industries Price vs Earnings
The Price-to-Earnings (PE) ratio is a favored valuation tool for companies with consistent profits, like Techtronic Industries. Since earnings are a direct measure of what a business generates for its shareholders, the PE ratio provides investors with a snapshot of how much they are paying for each dollar of earnings. This serves as a yardstick that is especially relevant for mature, profitable firms.
It’s important to remember that a “normal” or “fair” PE ratio is not a fixed number. Factors such as a company’s growth expectations and risk profile can cause this metric to vary across companies and industries. Higher growth prospects and lower risk might justify a higher PE, while greater risk or lower expected growth would usually mean a lower PE is more reasonable.
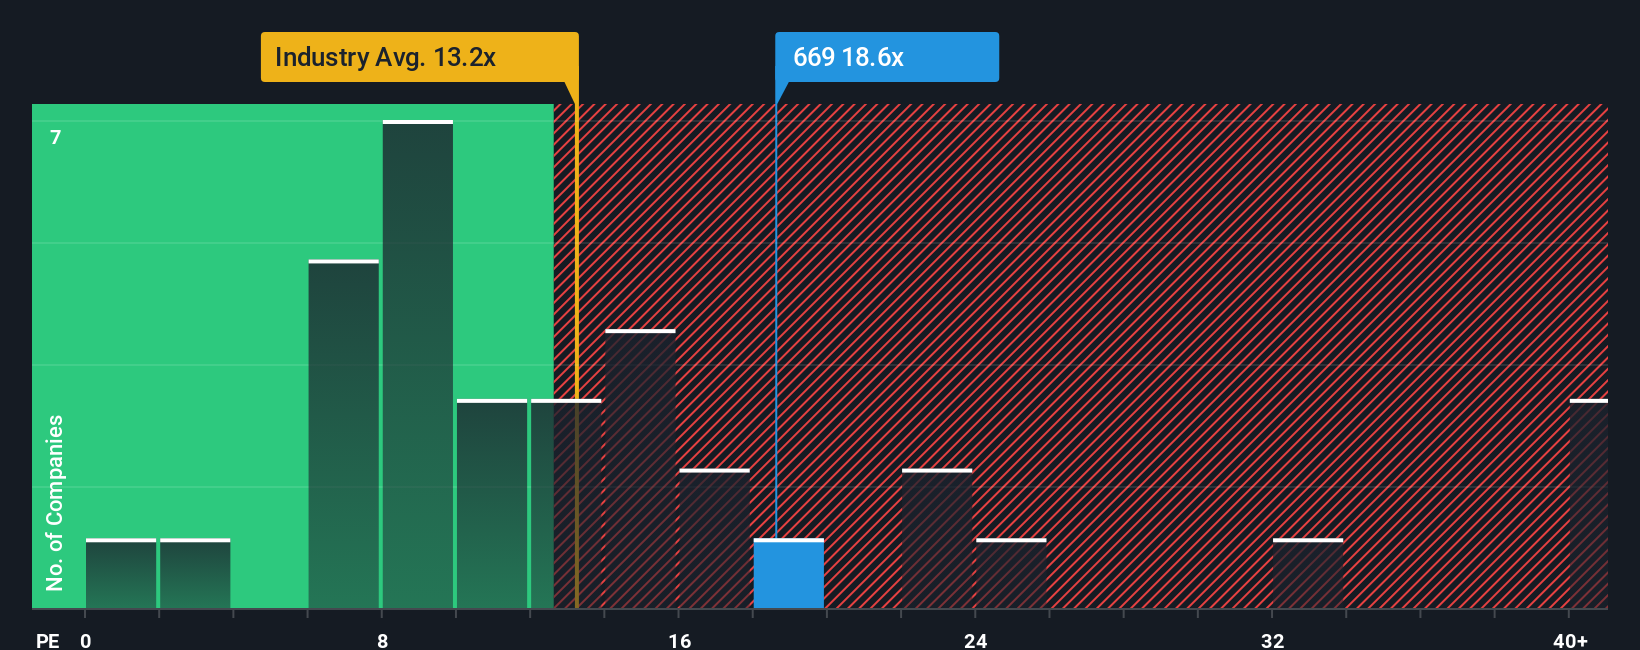
Looking at Techtronic Industries, the current PE ratio stands at 18.5x, which is notably higher than both the industry average of 12.6x and the company’s peer set at 14.0x. However, relying only on these comparisons can be misleading without factoring in specific strengths and risks unique to Techtronic. That is where Simply Wall St's “Fair Ratio” comes in. It is a deeper measure that sets the ideal PE for Techtronic by considering not just industry context but also earnings growth, profit margins, company size and risk exposure. For Techtronic Industries, the Fair Ratio is calculated at 12.9x.
Since the company’s actual PE (18.5x) is considerably above its Fair Ratio (12.9x), this suggests the stock is currently overvalued on an earnings basis, even if some high-quality attributes are at play.
Result: OVERVALUED
PE ratios tell one story, but what if the real opportunity lies elsewhere? Discover companies where insiders are betting big on explosive growth.
Upgrade Your Decision Making: Choose your Techtronic Industries Narrative
Earlier we mentioned that there's an even better way to understand valuation, so let's introduce you to Narratives. At its core, a Narrative is simply your story—your perspective on a company’s future—that connects your assumptions about fair value, future revenue, earnings, and profit margins with what you believe is possible for the business.
Narratives turn complex analysis into something personal and actionable by linking a company’s unique business story to financial forecasts, and then directly to a calculated fair value. They are accessible, dynamic, and easy to use. Narratives are available for millions of investors on Simply Wall St’s Community page, allowing anyone to capture and update their outlook as new information becomes available, whether it is fresh news or recent earnings results.
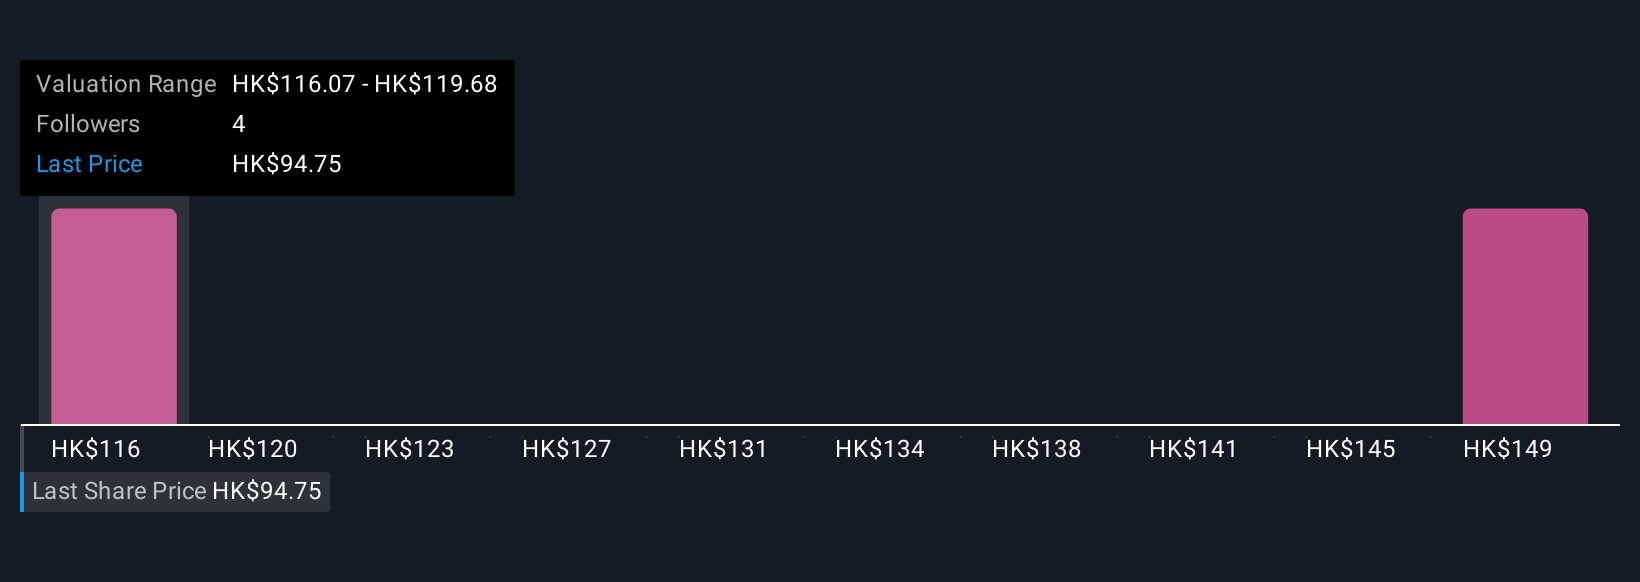
With Narratives, you can easily see if your own view suggests the stock is a buy or sell by comparing your fair value to the current market price, and update your assumptions as the facts change. For example, on Techtronic Industries, some users set their fair value as high as HK$135, while others are more cautious with targets nearer HK$95, reflecting a range of possible outcomes and investment styles.
Do you think there's more to the story for Techtronic Industries? Create your own Narrative to let the Community know!
This article by Simply Wall St is general in nature. We provide commentary based on historical data and analyst forecasts only using an unbiased methodology and our articles are not intended to be financial advice. It does not constitute a recommendation to buy or sell any stock, and does not take account of your objectives, or your financial situation. We aim to bring you long-term focused analysis driven by fundamental data. Note that our analysis may not factor in the latest price-sensitive company announcements or qualitative material. Simply Wall St has no position in any stocks mentioned.
The New Payments ETF Is Live on NASDAQ:
Money is moving to real-time rails, and a newly listed ETF now gives investors direct exposure. Fast settlement. Institutional custody. Simple access.
Explore how this launch could reshape portfolios
Sponsored ContentValuation is complex, but we're here to simplify it.
Discover if Techtronic Industries might be undervalued or overvalued with our detailed analysis, featuring fair value estimates, potential risks, dividends, insider trades, and its financial condition.
Access Free AnalysisHave feedback on this article? Concerned about the content? Get in touch with us directly. Alternatively, email editorial-team@simplywallst.com
About SEHK:669
Techtronic Industries
Engages in the provision of power tools, outdoor power equipment, and floorcare and cleaning products.
Flawless balance sheet with solid track record and pays a dividend.
Similar Companies
Market Insights

Weekly Picks

THE KINGDOM OF BROWN GOODS: WHY MGPI IS BEING CRUSHED BY INVENTORY & PRIMED FOR RESURRECTION


Why Vertical Aerospace (NYSE: EVTL) is Worth Possibly Over 13x its Current Price


The Quiet Giant That Became AI’s Power Grid
Recently Updated Narratives


MINISO's fair value is projected at 26.69 with an anticipated PE ratio shift of 20x

Fiverr International will transform the freelance industry with AI-powered growth

Stride Stock: Online Education Finds Its Second Act
Popular Narratives


MicroVision will explode future revenue by 380.37% with a vision towards success


Crazy Undervalued 42 Baggers Silver Play (Active & Running Mine)


