- Hong Kong
- /
- Construction
- /
- SEHK:2863
Golden Faith Group Holdings (HKG:2863) Is Reinvesting At Lower Rates Of Return


Did you know there are some financial metrics that can provide clues of a potential multi-bagger? In a perfect world, we'd like to see a company investing more capital into its business and ideally the returns earned from that capital are also increasing. Basically this means that a company has profitable initiatives that it can continue to reinvest in, which is a trait of a compounding machine. Having said that, from a first glance at Golden Faith Group Holdings (HKG:2863) we aren't jumping out of our chairs at how returns are trending, but let's have a deeper look.
Return On Capital Employed (ROCE): What Is It?
For those who don't know, ROCE is a measure of a company's yearly pre-tax profit (its return), relative to the capital employed in the business. Analysts use this formula to calculate it for Golden Faith Group Holdings:
Return on Capital Employed = Earnings Before Interest and Tax (EBIT) ÷ (Total Assets - Current Liabilities)
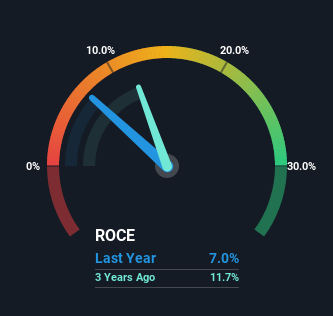
0.07 = HK$21m ÷ (HK$326m - HK$24m) (Based on the trailing twelve months to March 2022).
So, Golden Faith Group Holdings has an ROCE of 7.0%. Even though it's in line with the industry average of 7.0%, it's still a low return by itself.
Check out the opportunities and risks within the HK Construction industry.
While the past is not representative of the future, it can be helpful to know how a company has performed historically, which is why we have this chart above. If you're interested in investigating Golden Faith Group Holdings' past further, check out this free graph of past earnings, revenue and cash flow.
The Trend Of ROCE
When we looked at the ROCE trend at Golden Faith Group Holdings, we didn't gain much confidence. Over the last five years, returns on capital have decreased to 7.0% from 32% five years ago. Although, given both revenue and the amount of assets employed in the business have increased, it could suggest the company is investing in growth, and the extra capital has led to a short-term reduction in ROCE. And if the increased capital generates additional returns, the business, and thus shareholders, will benefit in the long run.
On a related note, Golden Faith Group Holdings has decreased its current liabilities to 7.4% of total assets. That could partly explain why the ROCE has dropped. Effectively this means their suppliers or short-term creditors are funding less of the business, which reduces some elements of risk. Some would claim this reduces the business' efficiency at generating ROCE since it is now funding more of the operations with its own money.
The Bottom Line On Golden Faith Group Holdings' ROCE
Even though returns on capital have fallen in the short term, we find it promising that revenue and capital employed have both increased for Golden Faith Group Holdings. And there could be an opportunity here if other metrics look good too, because the stock has declined 44% in the last five years. So we think it'd be worthwhile to look further into this stock given the trends look encouraging.
Since virtually every company faces some risks, it's worth knowing what they are, and we've spotted 4 warning signs for Golden Faith Group Holdings (of which 2 don't sit too well with us!) that you should know about.
If you want to search for solid companies with great earnings, check out this free list of companies with good balance sheets and impressive returns on equity.
New: Manage All Your Stock Portfolios in One Place
We've created the ultimate portfolio companion for stock investors, and it's free.
• Connect an unlimited number of Portfolios and see your total in one currency
• Be alerted to new Warning Signs or Risks via email or mobile
• Track the Fair Value of your stocks
Have feedback on this article? Concerned about the content? Get in touch with us directly. Alternatively, email editorial-team (at) simplywallst.com.
This article by Simply Wall St is general in nature. We provide commentary based on historical data and analyst forecasts only using an unbiased methodology and our articles are not intended to be financial advice. It does not constitute a recommendation to buy or sell any stock, and does not take account of your objectives, or your financial situation. We aim to bring you long-term focused analysis driven by fundamental data. Note that our analysis may not factor in the latest price-sensitive company announcements or qualitative material. Simply Wall St has no position in any stocks mentioned.
About SEHK:2863
Golden Faith Group Holdings
An investment holding company, engages in the provision of electrical and mechanical engineering services in Hong Kong.
Flawless balance sheet slight.
Market Insights

Community Narratives


