- Hong Kong
- /
- Construction
- /
- SEHK:2863
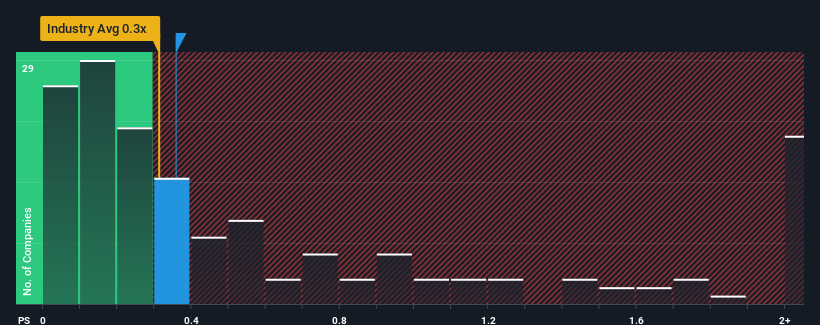
A Piece Of The Puzzle Missing From Golden Faith Group Holdings Limited's (HKG:2863) 29% Share Price Climb


Golden Faith Group Holdings Limited (HKG:2863) shareholders would be excited to see that the share price has had a great month, posting a 29% gain and recovering from prior weakness. Looking back a bit further, it's encouraging to see the stock is up 31% in the last year.
Even after such a large jump in price, you could still be forgiven for feeling indifferent about Golden Faith Group Holdings' P/S ratio of 0.4x, since the median price-to-sales (or "P/S") ratio for the Construction industry in Hong Kong is also close to 0.3x. However, investors might be overlooking a clear opportunity or potential setback if there is no rational basis for the P/S.
See our latest analysis for Golden Faith Group Holdings
How Has Golden Faith Group Holdings Performed Recently?
Recent times have been quite advantageous for Golden Faith Group Holdings as its revenue has been rising very briskly. It might be that many expect the strong revenue performance to wane, which has kept the share price, and thus the P/S ratio, from rising. Those who are bullish on Golden Faith Group Holdings will be hoping that this isn't the case, so that they can pick up the stock at a lower valuation.
We don't have analyst forecasts, but you can see how recent trends are setting up the company for the future by checking out our free report on Golden Faith Group Holdings' earnings, revenue and cash flow.Do Revenue Forecasts Match The P/S Ratio?
Golden Faith Group Holdings' P/S ratio would be typical for a company that's only expected to deliver moderate growth, and importantly, perform in line with the industry.
Retrospectively, the last year delivered an exceptional 93% gain to the company's top line. Pleasingly, revenue has also lifted 175% in aggregate from three years ago, thanks to the last 12 months of growth. Accordingly, shareholders would have definitely welcomed those medium-term rates of revenue growth.
Comparing that to the industry, which is only predicted to deliver 11% growth in the next 12 months, the company's momentum is stronger based on recent medium-term annualised revenue results.
With this information, we find it interesting that Golden Faith Group Holdings is trading at a fairly similar P/S compared to the industry. It may be that most investors are not convinced the company can maintain its recent growth rates.
The Key Takeaway
Its shares have lifted substantially and now Golden Faith Group Holdings' P/S is back within range of the industry median. Using the price-to-sales ratio alone to determine if you should sell your stock isn't sensible, however it can be a practical guide to the company's future prospects.
To our surprise, Golden Faith Group Holdings revealed its three-year revenue trends aren't contributing to its P/S as much as we would have predicted, given they look better than current industry expectations. It'd be fair to assume that potential risks the company faces could be the contributing factor to the lower than expected P/S. While recent revenue trends over the past medium-term suggest that the risk of a price decline is low, investors appear to see the likelihood of revenue fluctuations in the future.
It is also worth noting that we have found 3 warning signs for Golden Faith Group Holdings (1 makes us a bit uncomfortable!) that you need to take into consideration.
If you're unsure about the strength of Golden Faith Group Holdings' business, why not explore our interactive list of stocks with solid business fundamentals for some other companies you may have missed.
If you're looking to trade Golden Faith Group Holdings, open an account with the lowest-cost platform trusted by professionals, Interactive Brokers.
With clients in over 200 countries and territories, and access to 160 markets, IBKR lets you trade stocks, options, futures, forex, bonds and funds from a single integrated account.
Enjoy no hidden fees, no account minimums, and FX conversion rates as low as 0.03%, far better than what most brokers offer.
Sponsored ContentNew: Manage All Your Stock Portfolios in One Place
We've created the ultimate portfolio companion for stock investors, and it's free.
• Connect an unlimited number of Portfolios and see your total in one currency
• Be alerted to new Warning Signs or Risks via email or mobile
• Track the Fair Value of your stocks
Have feedback on this article? Concerned about the content? Get in touch with us directly. Alternatively, email editorial-team (at) simplywallst.com.
This article by Simply Wall St is general in nature. We provide commentary based on historical data and analyst forecasts only using an unbiased methodology and our articles are not intended to be financial advice. It does not constitute a recommendation to buy or sell any stock, and does not take account of your objectives, or your financial situation. We aim to bring you long-term focused analysis driven by fundamental data. Note that our analysis may not factor in the latest price-sensitive company announcements or qualitative material. Simply Wall St has no position in any stocks mentioned.
About SEHK:2863
Golden Faith Group Holdings
An investment holding company, engages in the provision of electrical and mechanical engineering services in Hong Kong.
Flawless balance sheet slight.
Market Insights

Community Narratives


