- Hong Kong
- /
- Industrials
- /
- SEHK:274
The Market Lifts Renaissance Asia Silk Road Group Limited (HKG:274) Shares 37% But It Can Do More


Those holding Renaissance Asia Silk Road Group Limited (HKG:274) shares would be relieved that the share price has rebounded 37% in the last thirty days, but it needs to keep going to repair the recent damage it has caused to investor portfolios. Still, the 30-day jump doesn't change the fact that longer term shareholders have seen their stock decimated by the 62% share price drop in the last twelve months.
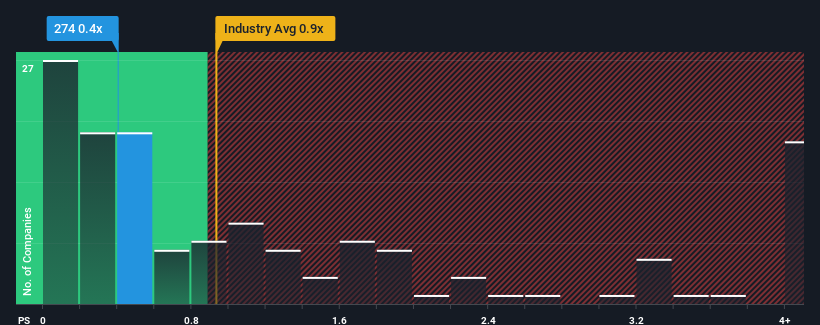
Even after such a large jump in price, you could still be forgiven for feeling indifferent about Renaissance Asia Silk Road Group's P/S ratio of 0.4x, since the median price-to-sales (or "P/S") ratio for the Industrials industry in Hong Kong is about the same. However, investors might be overlooking a clear opportunity or potential setback if there is no rational basis for the P/S.
Check out our latest analysis for Renaissance Asia Silk Road Group
What Does Renaissance Asia Silk Road Group's P/S Mean For Shareholders?
Renaissance Asia Silk Road Group certainly has been doing a great job lately as it's been growing its revenue at a really rapid pace. It might be that many expect the strong revenue performance to wane, which has kept the share price, and thus the P/S ratio, from rising. If you like the company, you'd be hoping this isn't the case so that you could potentially pick up some stock while it's not quite in favour.
Although there are no analyst estimates available for Renaissance Asia Silk Road Group, take a look at this free data-rich visualisation to see how the company stacks up on earnings, revenue and cash flow.What Are Revenue Growth Metrics Telling Us About The P/S?
There's an inherent assumption that a company should be matching the industry for P/S ratios like Renaissance Asia Silk Road Group's to be considered reasonable.
Retrospectively, the last year delivered an exceptional 67% gain to the company's top line. The latest three year period has also seen an incredible overall rise in revenue, aided by its incredible short-term performance. So we can start by confirming that the company has done a tremendous job of growing revenue over that time.
Comparing that to the industry, which is only predicted to deliver 8.6% growth in the next 12 months, the company's momentum is stronger based on recent medium-term annualised revenue results.
With this information, we find it interesting that Renaissance Asia Silk Road Group is trading at a fairly similar P/S compared to the industry. It may be that most investors are not convinced the company can maintain its recent growth rates.
The Final Word
Renaissance Asia Silk Road Group's stock has a lot of momentum behind it lately, which has brought its P/S level with the rest of the industry. Generally, our preference is to limit the use of the price-to-sales ratio to establishing what the market thinks about the overall health of a company.
We didn't quite envision Renaissance Asia Silk Road Group's P/S sitting in line with the wider industry, considering the revenue growth over the last three-year is higher than the current industry outlook. It'd be fair to assume that potential risks the company faces could be the contributing factor to the lower than expected P/S. At least the risk of a price drop looks to be subdued if recent medium-term revenue trends continue, but investors seem to think future revenue could see some volatility.
Before you take the next step, you should know about the 3 warning signs for Renaissance Asia Silk Road Group (2 are a bit concerning!) that we have uncovered.
If strong companies turning a profit tickle your fancy, then you'll want to check out this free list of interesting companies that trade on a low P/E (but have proven they can grow earnings).
New: AI Stock Screener & Alerts
Our new AI Stock Screener scans the market every day to uncover opportunities.
• Dividend Powerhouses (3%+ Yield)
• Undervalued Small Caps with Insider Buying
• High growth Tech and AI Companies
Or build your own from over 50 metrics.
Have feedback on this article? Concerned about the content? Get in touch with us directly. Alternatively, email editorial-team (at) simplywallst.com.
This article by Simply Wall St is general in nature. We provide commentary based on historical data and analyst forecasts only using an unbiased methodology and our articles are not intended to be financial advice. It does not constitute a recommendation to buy or sell any stock, and does not take account of your objectives, or your financial situation. We aim to bring you long-term focused analysis driven by fundamental data. Note that our analysis may not factor in the latest price-sensitive company announcements or qualitative material. Simply Wall St has no position in any stocks mentioned.
About SEHK:274
Renaissance Asia Silk Road Group
An investment holding company, engages in the exploration, mining, trading, and sale of gold products in the People's Republic of China.
Slight and slightly overvalued.
Market Insights

Community Narratives
