
Advertisement
- Hong Kong
- /
- Construction
- /
- SEHK:2258
Watts International Maritime (HKG:2258) Has Some Difficulty Using Its Capital Effectively
If you're looking at a mature business that's past the growth phase, what are some of the underlying trends that pop up? Typically, we'll see the trend of both return on capital employed (ROCE) declining and this usually coincides with a decreasing amount of capital employed. Basically the company is earning less on its investments and it is also reducing its total assets. In light of that, from a first glance at Watts International Maritime (HKG:2258), we've spotted some signs that it could be struggling, so let's investigate.
What Is Return On Capital Employed (ROCE)?
Just to clarify if you're unsure, ROCE is a metric for evaluating how much pre-tax income (in percentage terms) a company earns on the capital invested in its business. To calculate this metric for Watts International Maritime, this is the formula:
Return on Capital Employed = Earnings Before Interest and Tax (EBIT) ÷ (Total Assets - Current Liabilities)
0.07 = CN¥67m ÷ (CN¥3.2b - CN¥2.3b) (Based on the trailing twelve months to December 2023).
Thus, Watts International Maritime has an ROCE of 7.0%. On its own, that's a low figure but it's around the 7.7% average generated by the Construction industry.
Check out our latest analysis for Watts International Maritime
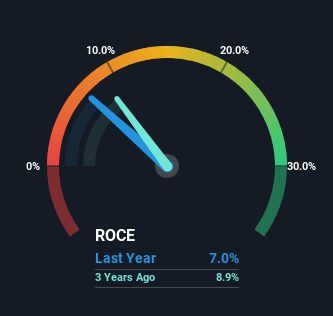
Historical performance is a great place to start when researching a stock so above you can see the gauge for Watts International Maritime's ROCE against it's prior returns. If you're interested in investigating Watts International Maritime's past further, check out this free graph covering Watts International Maritime's past earnings, revenue and cash flow.
What The Trend Of ROCE Can Tell Us
We are a bit anxious about the trends of ROCE at Watts International Maritime. To be more specific, today's ROCE was 14% five years ago but has since fallen to 7.0%. What's equally concerning is that the amount of capital deployed in the business has shrunk by 28% over that same period. The combination of lower ROCE and less capital employed can indicate that a business is likely to be facing some competitive headwinds or seeing an erosion to its moat. Typically businesses that exhibit these characteristics aren't the ones that tend to multiply over the long term, because statistically speaking, they've already gone through the growth phase of their life cycle.
Another thing to note, Watts International Maritime has a high ratio of current liabilities to total assets of 70%. This effectively means that suppliers (or short-term creditors) are funding a large portion of the business, so just be aware that this can introduce some elements of risk. While it's not necessarily a bad thing, it can be beneficial if this ratio is lower.
The Bottom Line
In summary, it's unfortunate that Watts International Maritime is shrinking its capital base and also generating lower returns. Unsurprisingly then, the stock has dived 83% over the last five years, so investors are recognizing these changes and don't like the company's prospects. Unless there is a shift to a more positive trajectory in these metrics, we would look elsewhere.
One more thing: We've identified 4 warning signs with Watts International Maritime (at least 1 which is concerning) , and understanding these would certainly be useful.
While Watts International Maritime may not currently earn the highest returns, we've compiled a list of companies that currently earn more than 25% return on equity. Check out this free list here.
Valuation is complex, but we're here to simplify it.
Discover if Watts International Maritime might be undervalued or overvalued with our detailed analysis, featuring fair value estimates, potential risks, dividends, insider trades, and its financial condition.
Access Free AnalysisHave feedback on this article? Concerned about the content? Get in touch with us directly. Alternatively, email editorial-team (at) simplywallst.com.
This article by Simply Wall St is general in nature. We provide commentary based on historical data and analyst forecasts only using an unbiased methodology and our articles are not intended to be financial advice. It does not constitute a recommendation to buy or sell any stock, and does not take account of your objectives, or your financial situation. We aim to bring you long-term focused analysis driven by fundamental data. Note that our analysis may not factor in the latest price-sensitive company announcements or qualitative material. Simply Wall St has no position in any stocks mentioned.
About SEHK:2258
Watts International Maritime
An investment holding company, provides port, waterway, marine engineering, and municipal public engineering services in the People's Republic of China.
Excellent balance sheet and good value.
Market Insights

Advertisement
Community Narratives
The company that turned a verb into a global necessity and basically runs the modern internet, digital ads, smartphones, maps, and AI.
Fair Value US$300.00|6.3% undervalued
OS
Community Contributor
Flowers Foods Pays A Fair Price For Health
Fair Value US$16.12|26.0% undervalued
NV
Community Contributor
TMX Group will thrive with 33.3% profit margin and enduring market moat
Fair Value CA$49.90|3.7% overvalued
LI
Community Contributor