
Advertisement
Returns On Capital At Pujiang International Group (HKG:2060) Have Hit The Brakes

To find a multi-bagger stock, what are the underlying trends we should look for in a business? Firstly, we'd want to identify a growing return on capital employed (ROCE) and then alongside that, an ever-increasing base of capital employed. Ultimately, this demonstrates that it's a business that is reinvesting profits at increasing rates of return. With that in mind, the ROCE of Pujiang International Group (HKG:2060) looks decent, right now, so lets see what the trend of returns can tell us.
Understanding Return On Capital Employed (ROCE)
Just to clarify if you're unsure, ROCE is a metric for evaluating how much pre-tax income (in percentage terms) a company earns on the capital invested in its business. Analysts use this formula to calculate it for Pujiang International Group:
Return on Capital Employed = Earnings Before Interest and Tax (EBIT) ÷ (Total Assets - Current Liabilities)
0.14 = CN¥339m ÷ (CN¥5.8b - CN¥3.3b) (Based on the trailing twelve months to June 2023).
Thus, Pujiang International Group has an ROCE of 14%. On its own, that's a standard return, however it's much better than the 8.6% generated by the Machinery industry.
See our latest analysis for Pujiang International Group
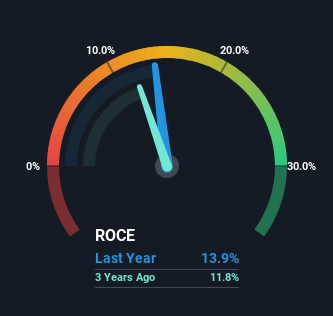
Historical performance is a great place to start when researching a stock so above you can see the gauge for Pujiang International Group's ROCE against it's prior returns. If you want to delve into the historical earnings , check out these free graphs detailing revenue and cash flow performance of Pujiang International Group.
What Does the ROCE Trend For Pujiang International Group Tell Us?
While the current returns on capital are decent, they haven't changed much. The company has consistently earned 14% for the last five years, and the capital employed within the business has risen 104% in that time. 14% is a pretty standard return, and it provides some comfort knowing that Pujiang International Group has consistently earned this amount. Over long periods of time, returns like these might not be too exciting, but with consistency they can pay off in terms of share price returns.
On another note, while the change in ROCE trend might not scream for attention, it's interesting that the current liabilities have actually gone up over the last five years. This is intriguing because if current liabilities hadn't increased to 58% of total assets, this reported ROCE would probably be less than14% because total capital employed would be higher.The 14% ROCE could be even lower if current liabilities weren't 58% of total assets, because the the formula would show a larger base of total capital employed. Additionally, this high level of current liabilities isn't ideal because it means the company's suppliers (or short-term creditors) are effectively funding a large portion of the business.
The Bottom Line
In the end, Pujiang International Group has proven its ability to adequately reinvest capital at good rates of return. What's surprising though is that the stock has collapsed 94% over the last three years, so there might be other areas of the business hurting its prospects. So in light of that'd we think it's worthwhile looking further into this stock to see if there's any areas for concern.
Since virtually every company faces some risks, it's worth knowing what they are, and we've spotted 3 warning signs for Pujiang International Group (of which 1 can't be ignored!) that you should know about.
While Pujiang International Group may not currently earn the highest returns, we've compiled a list of companies that currently earn more than 25% return on equity. Check out this free list here.
New: Manage All Your Stock Portfolios in One Place
We've created the ultimate portfolio companion for stock investors, and it's free.
• Connect an unlimited number of Portfolios and see your total in one currency
• Be alerted to new Warning Signs or Risks via email or mobile
• Track the Fair Value of your stocks
Have feedback on this article? Concerned about the content? Get in touch with us directly. Alternatively, email editorial-team (at) simplywallst.com.
This article by Simply Wall St is general in nature. We provide commentary based on historical data and analyst forecasts only using an unbiased methodology and our articles are not intended to be financial advice. It does not constitute a recommendation to buy or sell any stock, and does not take account of your objectives, or your financial situation. We aim to bring you long-term focused analysis driven by fundamental data. Note that our analysis may not factor in the latest price-sensitive company announcements or qualitative material. Simply Wall St has no position in any stocks mentioned.
About SEHK:2060
Pujiang International Group
An investment holding company, manufactures, sells, and installs bridge cables and prestressed materials in the People’s Republic of China.
Slightly overvalued with imperfect balance sheet.
Market Insights

Advertisement
Community Narratives

Apple: A Dying Star with an Overpriced Valuation
Fair Value US$177.34|19.1% overvalued
IN
Community Contributor
Avino a case for USD$20 per share within 5 years (assuming $3,500 gold, $100 silver and $4 copper).
Fair Value CA$26.79|86.0% undervalued
AG
Community Contributor
Riding the Defense Boom RENK Sees Revenue Climb at 15% CAGR by FY 2029
Fair Value €69.87|14.3% undervalued
CH
Community Contributor