Increases to FSM Holdings Limited's (HKG:1721) CEO Compensation Might Cool off for now


Key Insights
- FSM Holdings' Annual General Meeting to take place on 3rd of June
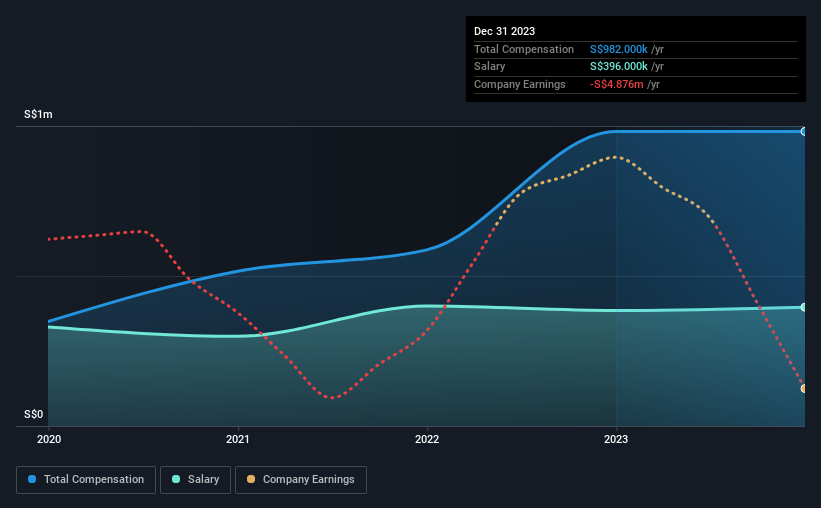
- Salary of S$396.0k is part of CEO Tiong-Hock Toe's total remuneration
- Total compensation is 189% above industry average
- FSM Holdings' total shareholder return over the past three years was 2.7% while its EPS grew by 38% over the past three years
CEO Tiong-Hock Toe has done a decent job of delivering relatively good performance at FSM Holdings Limited (HKG:1721) recently. In light of this performance, CEO compensation will probably not be the main focus for shareholders as they go into the AGM on 3rd of June. However, some shareholders may still want to keep CEO compensation within reason.
Check out our latest analysis for FSM Holdings
How Does Total Compensation For Tiong-Hock Toe Compare With Other Companies In The Industry?
Our data indicates that FSM Holdings Limited has a market capitalization of HK$380m, and total annual CEO compensation was reported as S$982k for the year to December 2023. There was no change in the compensation compared to last year. We think total compensation is more important but our data shows that the CEO salary is lower, at S$396k.
On comparing similar-sized companies in the Hong Kong Machinery industry with market capitalizations below HK$1.6b, we found that the median total CEO compensation was S$340k. This suggests that Tiong-Hock Toe is paid more than the median for the industry.
| Component | 2023 | 2022 | Proportion (2023) |
| Salary | S$396k | S$385k | 40% |
| Other | S$586k | S$597k | 60% |
| Total Compensation | S$982k | S$982k | 100% |
On an industry level, around 77% of total compensation represents salary and 23% is other remuneration. In FSM Holdings' case, non-salary compensation represents a greater slice of total remuneration, in comparison to the broader industry. If non-salary compensation dominates total pay, it's an indicator that the executive's salary is tied to company performance.
A Look at FSM Holdings Limited's Growth Numbers
FSM Holdings Limited's earnings per share (EPS) grew 38% per year over the last three years. It saw its revenue drop 31% over the last year.
This demonstrates that the company has been improving recently and is good news for the shareholders. The lack of revenue growth isn't ideal, but it is the bottom line that counts most in business. We don't have analyst forecasts, but you could get a better understanding of its growth by checking out this more detailed historical graph of earnings, revenue and cash flow.
Has FSM Holdings Limited Been A Good Investment?
FSM Holdings Limited has generated a total shareholder return of 2.7% over three years, so most shareholders wouldn't be too disappointed. Although, there's always room to improve. As a result, investors in the company might be reluctant about agreeing to increase CEO pay in the future, before seeing an improvement on their returns.
To Conclude...
Given that the company's overall performance has been reasonable, the CEO remuneration policy might not be shareholders' central point of focus in the upcoming AGM. Still, not all shareholders might be in favor of a pay raise to the CEO, seeing that they are already being paid higher than the industry.
It is always advisable to analyse CEO pay, along with performing a thorough analysis of the company's key performance areas. We identified 2 warning signs for FSM Holdings (1 is significant!) that you should be aware of before investing here.
Arguably, business quality is much more important than CEO compensation levels. So check out this free list of interesting companies that have HIGH return on equity and low debt.
New: AI Stock Screener & Alerts
Our new AI Stock Screener scans the market every day to uncover opportunities.
• Dividend Powerhouses (3%+ Yield)
• Undervalued Small Caps with Insider Buying
• High growth Tech and AI Companies
Or build your own from over 50 metrics.
Have feedback on this article? Concerned about the content? Get in touch with us directly. Alternatively, email editorial-team (at) simplywallst.com.
This article by Simply Wall St is general in nature. We provide commentary based on historical data and analyst forecasts only using an unbiased methodology and our articles are not intended to be financial advice. It does not constitute a recommendation to buy or sell any stock, and does not take account of your objectives, or your financial situation. We aim to bring you long-term focused analysis driven by fundamental data. Note that our analysis may not factor in the latest price-sensitive company announcements or qualitative material. Simply Wall St has no position in any stocks mentioned.
About SEHK:1721
FSM Holdings
An investment holding company, operates as a sheet metal fabricator.
Excellent balance sheet very low.
Market Insights

Community Narratives


