
Advertisement
- Hong Kong
- /
- Construction
- /
- SEHK:1718
Wan Kei Group Holdings Limited's (HKG:1718) 30% Share Price Plunge Could Signal Some Risk

The Wan Kei Group Holdings Limited (HKG:1718) share price has fared very poorly over the last month, falling by a substantial 30%. The drop over the last 30 days has capped off a tough year for shareholders, with the share price down 37% in that time.
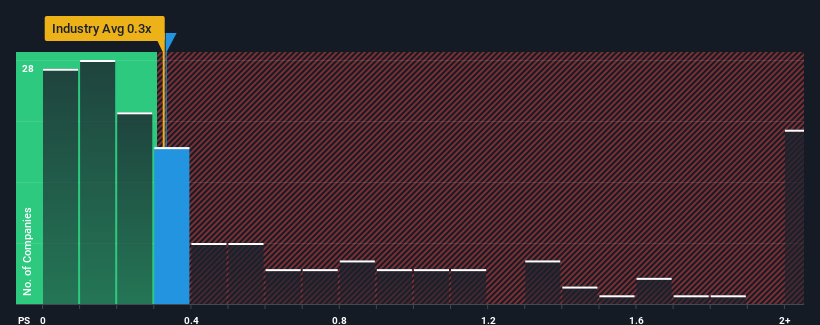
Even after such a large drop in price, there still wouldn't be many who think Wan Kei Group Holdings' price-to-sales (or "P/S") ratio of 0.3x is worth a mention when it essentially matches the median P/S in Hong Kong's Construction industry. While this might not raise any eyebrows, if the P/S ratio is not justified investors could be missing out on a potential opportunity or ignoring looming disappointment.
View our latest analysis for Wan Kei Group Holdings
What Does Wan Kei Group Holdings' Recent Performance Look Like?
For example, consider that Wan Kei Group Holdings' financial performance has been pretty ordinary lately as revenue growth is non-existent. One possibility is that the P/S is moderate because investors think this benign revenue growth rate might not be enough to outperform the broader industry in the near future. If you like the company, you'd be hoping this isn't the case so that you could potentially pick up some stock while it's not quite in favour.
Want the full picture on earnings, revenue and cash flow for the company? Then our free report on Wan Kei Group Holdings will help you shine a light on its historical performance.Is There Some Revenue Growth Forecasted For Wan Kei Group Holdings?
Wan Kei Group Holdings' P/S ratio would be typical for a company that's only expected to deliver moderate growth, and importantly, perform in line with the industry.
If we review the last year of revenue, the company posted a result that saw barely any deviation from a year ago. The longer-term trend has been no better as the company has no revenue growth to show for over the last three years either. Therefore, it's fair to say that revenue growth has definitely eluded the company recently.
Comparing that to the industry, which is predicted to deliver 9.5% growth in the next 12 months, the company's momentum is weaker, based on recent medium-term annualised revenue results.
With this information, we find it interesting that Wan Kei Group Holdings is trading at a fairly similar P/S compared to the industry. It seems most investors are ignoring the fairly limited recent growth rates and are willing to pay up for exposure to the stock. They may be setting themselves up for future disappointment if the P/S falls to levels more in line with recent growth rates.
The Bottom Line On Wan Kei Group Holdings' P/S
Wan Kei Group Holdings' plummeting stock price has brought its P/S back to a similar region as the rest of the industry. While the price-to-sales ratio shouldn't be the defining factor in whether you buy a stock or not, it's quite a capable barometer of revenue expectations.
Our examination of Wan Kei Group Holdings revealed its poor three-year revenue trends aren't resulting in a lower P/S as per our expectations, given they look worse than current industry outlook. Right now we are uncomfortable with the P/S as this revenue performance isn't likely to support a more positive sentiment for long. Unless there is a significant improvement in the company's medium-term performance, it will be difficult to prevent the P/S ratio from declining to a more reasonable level.
It is also worth noting that we have found 3 warning signs for Wan Kei Group Holdings (1 is potentially serious!) that you need to take into consideration.
If strong companies turning a profit tickle your fancy, then you'll want to check out this free list of interesting companies that trade on a low P/E (but have proven they can grow earnings).
Valuation is complex, but we're here to simplify it.
Discover if Wan Kei Group Holdings might be undervalued or overvalued with our detailed analysis, featuring fair value estimates, potential risks, dividends, insider trades, and its financial condition.
Access Free AnalysisHave feedback on this article? Concerned about the content? Get in touch with us directly. Alternatively, email editorial-team (at) simplywallst.com.
This article by Simply Wall St is general in nature. We provide commentary based on historical data and analyst forecasts only using an unbiased methodology and our articles are not intended to be financial advice. It does not constitute a recommendation to buy or sell any stock, and does not take account of your objectives, or your financial situation. We aim to bring you long-term focused analysis driven by fundamental data. Note that our analysis may not factor in the latest price-sensitive company announcements or qualitative material. Simply Wall St has no position in any stocks mentioned.
About SEHK:1718
Wan Kei Group Holdings
An investment holding company, provides foundation and ground investigation field works to public and private sectors in Hong Kong.
Adequate balance sheet very low.
Similar Companies
Market Insights

Advertisement
Community Narratives
Scaling up in building materials with smart M&A and growing profitability
Fair Value US$2.77|24.5% undervalued
CM
Community Contributor
Hims: The Platform Powering Personalised Healthcare
Fair Value US$114.01|45.3% undervalued
BL
Community Contributor
Undervalued lottery company with strong fundamentals
Fair Value AU$15.00|33.9% undervalued
RO
Community Contributor
Proximus, transferring money from the impatient to the patient investor
Fair Value €16.62|56.1% undervalued
AX
Community Contributor