- Hong Kong
- /
- Industrials
- /
- SEHK:138
Positive Sentiment Still Eludes CCT Fortis Holdings Limited (HKG:138) Following 33% Share Price Slump


CCT Fortis Holdings Limited (HKG:138) shareholders that were waiting for something to happen have been dealt a blow with a 33% share price drop in the last month. The recent drop has obliterated the annual return, with the share price now down 2.5% over that longer period.
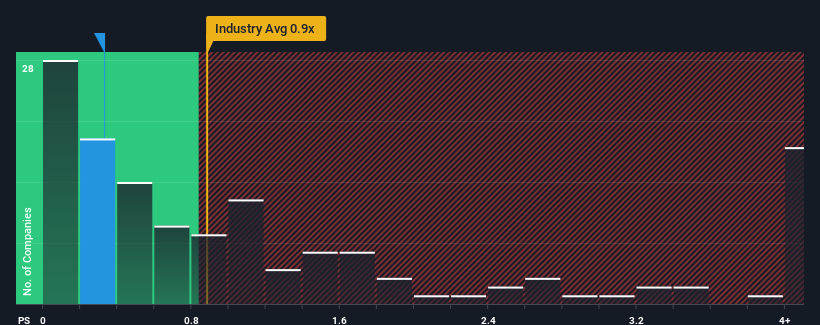
Even after such a large drop in price, it's still not a stretch to say that CCT Fortis Holdings' price-to-sales (or "P/S") ratio of 0.3x right now seems quite "middle-of-the-road" compared to the Industrials industry in Hong Kong, seeing as it matches the P/S ratio of the wider industry. While this might not raise any eyebrows, if the P/S ratio is not justified investors could be missing out on a potential opportunity or ignoring looming disappointment.
View our latest analysis for CCT Fortis Holdings
What Does CCT Fortis Holdings' Recent Performance Look Like?
As an illustration, revenue has deteriorated at CCT Fortis Holdings over the last year, which is not ideal at all. It might be that many expect the company to put the disappointing revenue performance behind them over the coming period, which has kept the P/S from falling. If you like the company, you'd at least be hoping this is the case so that you could potentially pick up some stock while it's not quite in favour.
Although there are no analyst estimates available for CCT Fortis Holdings, take a look at this free data-rich visualisation to see how the company stacks up on earnings, revenue and cash flow.What Are Revenue Growth Metrics Telling Us About The P/S?
CCT Fortis Holdings' P/S ratio would be typical for a company that's only expected to deliver moderate growth, and importantly, perform in line with the industry.
In reviewing the last year of financials, we were disheartened to see the company's revenues fell to the tune of 5.8%. Still, the latest three year period has seen an excellent 51% overall rise in revenue, in spite of its unsatisfying short-term performance. Accordingly, while they would have preferred to keep the run going, shareholders would definitely welcome the medium-term rates of revenue growth.
This is in contrast to the rest of the industry, which is expected to grow by 8.3% over the next year, materially lower than the company's recent medium-term annualised growth rates.
With this information, we find it interesting that CCT Fortis Holdings is trading at a fairly similar P/S compared to the industry. It may be that most investors are not convinced the company can maintain its recent growth rates.
The Key Takeaway
CCT Fortis Holdings' plummeting stock price has brought its P/S back to a similar region as the rest of the industry. Typically, we'd caution against reading too much into price-to-sales ratios when settling on investment decisions, though it can reveal plenty about what other market participants think about the company.
We've established that CCT Fortis Holdings currently trades on a lower than expected P/S since its recent three-year growth is higher than the wider industry forecast. It'd be fair to assume that potential risks the company faces could be the contributing factor to the lower than expected P/S. At least the risk of a price drop looks to be subdued if recent medium-term revenue trends continue, but investors seem to think future revenue could see some volatility.
We don't want to rain on the parade too much, but we did also find 4 warning signs for CCT Fortis Holdings (2 are significant!) that you need to be mindful of.
Of course, profitable companies with a history of great earnings growth are generally safer bets. So you may wish to see this free collection of other companies that have reasonable P/E ratios and have grown earnings strongly.
New: AI Stock Screener & Alerts
Our new AI Stock Screener scans the market every day to uncover opportunities.
• Dividend Powerhouses (3%+ Yield)
• Undervalued Small Caps with Insider Buying
• High growth Tech and AI Companies
Or build your own from over 50 metrics.
Have feedback on this article? Concerned about the content? Get in touch with us directly. Alternatively, email editorial-team (at) simplywallst.com.
This article by Simply Wall St is general in nature. We provide commentary based on historical data and analyst forecasts only using an unbiased methodology and our articles are not intended to be financial advice. It does not constitute a recommendation to buy or sell any stock, and does not take account of your objectives, or your financial situation. We aim to bring you long-term focused analysis driven by fundamental data. Note that our analysis may not factor in the latest price-sensitive company announcements or qualitative material. Simply Wall St has no position in any stocks mentioned.
About SEHK:138
CCT Fortis Holdings
An investment holding company, engages in the property, automotive, securities, cultural entertainment, and other businesses in Mainland China, Hong Kong, Macau, and internationally.
Slight and slightly overvalued.
Market Insights

Community Narratives
