- Hong Kong
- /
- Construction
- /
- SEHK:1220
Investors Give Zhidao International (Holdings) Limited (HKG:1220) Shares A 32% Hiding


Unfortunately for some shareholders, the Zhidao International (Holdings) Limited (HKG:1220) share price has dived 32% in the last thirty days, prolonging recent pain. Still, a bad month hasn't completely ruined the past year with the stock gaining 48%, which is great even in a bull market.
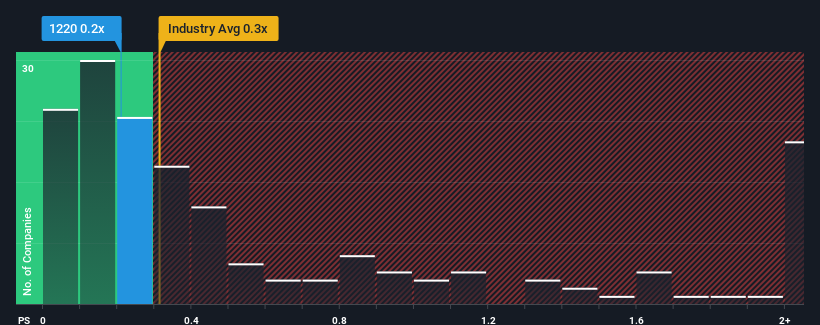
In spite of the heavy fall in price, you could still be forgiven for feeling indifferent about Zhidao International (Holdings)'s P/S ratio of 0.2x, since the median price-to-sales (or "P/S") ratio for the Construction industry in Hong Kong is also close to 0.3x. Although, it's not wise to simply ignore the P/S without explanation as investors may be disregarding a distinct opportunity or a costly mistake.
See our latest analysis for Zhidao International (Holdings)
What Does Zhidao International (Holdings)'s Recent Performance Look Like?
Recent times have been quite advantageous for Zhidao International (Holdings) as its revenue has been rising very briskly. It might be that many expect the strong revenue performance to wane, which has kept the share price, and thus the P/S ratio, from rising. If that doesn't eventuate, then existing shareholders have reason to be feeling optimistic about the future direction of the share price.
Want the full picture on earnings, revenue and cash flow for the company? Then our free report on Zhidao International (Holdings) will help you shine a light on its historical performance.Is There Some Revenue Growth Forecasted For Zhidao International (Holdings)?
In order to justify its P/S ratio, Zhidao International (Holdings) would need to produce growth that's similar to the industry.
Taking a look back first, we see that the company grew revenue by an impressive 206% last year. The strong recent performance means it was also able to grow revenue by 300% in total over the last three years. Accordingly, shareholders would have definitely welcomed those medium-term rates of revenue growth.
Comparing that recent medium-term revenue trajectory with the industry's one-year growth forecast of 11% shows it's noticeably more attractive.
In light of this, it's curious that Zhidao International (Holdings)'s P/S sits in line with the majority of other companies. It may be that most investors are not convinced the company can maintain its recent growth rates.
What Does Zhidao International (Holdings)'s P/S Mean For Investors?
Following Zhidao International (Holdings)'s share price tumble, its P/S is just clinging on to the industry median P/S. We'd say the price-to-sales ratio's power isn't primarily as a valuation instrument but rather to gauge current investor sentiment and future expectations.
We've established that Zhidao International (Holdings) currently trades on a lower than expected P/S since its recent three-year growth is higher than the wider industry forecast. When we see strong revenue with faster-than-industry growth, we can only assume potential risks are what might be placing pressure on the P/S ratio. It appears some are indeed anticipating revenue instability, because the persistence of these recent medium-term conditions would normally provide a boost to the share price.
You need to take note of risks, for example - Zhidao International (Holdings) has 2 warning signs (and 1 which makes us a bit uncomfortable) we think you should know about.
Of course, profitable companies with a history of great earnings growth are generally safer bets. So you may wish to see this free collection of other companies that have reasonable P/E ratios and have grown earnings strongly.
If you're looking to trade Zhidao International (Holdings), open an account with the lowest-cost platform trusted by professionals, Interactive Brokers.
With clients in over 200 countries and territories, and access to 160 markets, IBKR lets you trade stocks, options, futures, forex, bonds and funds from a single integrated account.
Enjoy no hidden fees, no account minimums, and FX conversion rates as low as 0.03%, far better than what most brokers offer.
Sponsored ContentValuation is complex, but we're here to simplify it.
Discover if Zhidao International (Holdings) might be undervalued or overvalued with our detailed analysis, featuring fair value estimates, potential risks, dividends, insider trades, and its financial condition.
Access Free AnalysisHave feedback on this article? Concerned about the content? Get in touch with us directly. Alternatively, email editorial-team (at) simplywallst.com.
This article by Simply Wall St is general in nature. We provide commentary based on historical data and analyst forecasts only using an unbiased methodology and our articles are not intended to be financial advice. It does not constitute a recommendation to buy or sell any stock, and does not take account of your objectives, or your financial situation. We aim to bring you long-term focused analysis driven by fundamental data. Note that our analysis may not factor in the latest price-sensitive company announcements or qualitative material. Simply Wall St has no position in any stocks mentioned.
About SEHK:1220
Zhidao International (Holdings)
An investment holding company, provides construction and engineering services in Hong Kong and Macau.
Flawless balance sheet slight.
Market Insights

Community Narratives


