

Howard Marks put it nicely when he said that, rather than worrying about share price volatility, 'The possibility of permanent loss is the risk I worry about... and every practical investor I know worries about.' So it seems the smart money knows that debt - which is usually involved in bankruptcies - is a very important factor, when you assess how risky a company is. We can see that Realord Group Holdings Limited (HKG:1196) does use debt in its business. But is this debt a concern to shareholders?
What Risk Does Debt Bring?
Generally speaking, debt only becomes a real problem when a company can't easily pay it off, either by raising capital or with its own cash flow. Part and parcel of capitalism is the process of 'creative destruction' where failed businesses are mercilessly liquidated by their bankers. However, a more frequent (but still costly) occurrence is where a company must issue shares at bargain-basement prices, permanently diluting shareholders, just to shore up its balance sheet. Of course, plenty of companies use debt to fund growth, without any negative consequences. The first step when considering a company's debt levels is to consider its cash and debt together.
Our analysis indicates that 1196 is potentially overvalued!
What Is Realord Group Holdings's Debt?
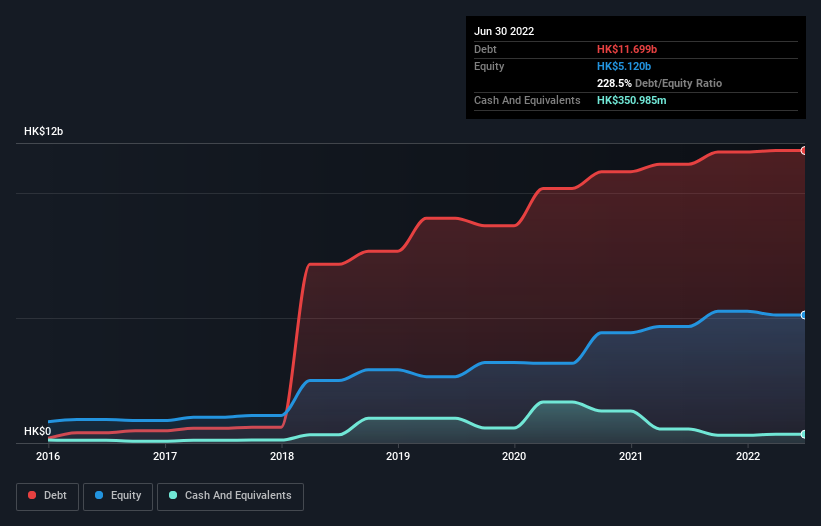
You can click the graphic below for the historical numbers, but it shows that as of June 2022 Realord Group Holdings had HK$11.7b of debt, an increase on HK$11.2b, over one year. However, it does have HK$351.0m in cash offsetting this, leading to net debt of about HK$11.3b.
How Healthy Is Realord Group Holdings' Balance Sheet?
We can see from the most recent balance sheet that Realord Group Holdings had liabilities of HK$5.85b falling due within a year, and liabilities of HK$7.99b due beyond that. Offsetting this, it had HK$351.0m in cash and HK$906.1m in receivables that were due within 12 months. So it has liabilities totalling HK$12.6b more than its cash and near-term receivables, combined.
This deficit is considerable relative to its market capitalization of HK$12.8b, so it does suggest shareholders should keep an eye on Realord Group Holdings' use of debt. This suggests shareholders would be heavily diluted if the company needed to shore up its balance sheet in a hurry. The balance sheet is clearly the area to focus on when you are analysing debt. But you can't view debt in total isolation; since Realord Group Holdings will need earnings to service that debt. So if you're keen to discover more about its earnings, it might be worth checking out this graph of its long term earnings trend.
In the last year Realord Group Holdings wasn't profitable at an EBIT level, but managed to grow its revenue by 32%, to HK$1.3b. Shareholders probably have their fingers crossed that it can grow its way to profits.
Caveat Emptor
While we can certainly appreciate Realord Group Holdings's revenue growth, its earnings before interest and tax (EBIT) loss is not ideal. To be specific the EBIT loss came in at HK$147m. Considering that alongside the liabilities mentioned above does not give us much confidence that company should be using so much debt. Quite frankly we think the balance sheet is far from match-fit, although it could be improved with time. Another cause for caution is that is bled HK$495m in negative free cash flow over the last twelve months. So suffice it to say we do consider the stock to be risky. When analysing debt levels, the balance sheet is the obvious place to start. But ultimately, every company can contain risks that exist outside of the balance sheet. To that end, you should learn about the 3 warning signs we've spotted with Realord Group Holdings (including 1 which shouldn't be ignored) .
When all is said and done, sometimes its easier to focus on companies that don't even need debt. Readers can access a list of growth stocks with zero net debt 100% free, right now.
New: AI Stock Screener & Alerts
Our new AI Stock Screener scans the market every day to uncover opportunities.
• Dividend Powerhouses (3%+ Yield)
• Undervalued Small Caps with Insider Buying
• High growth Tech and AI Companies
Or build your own from over 50 metrics.
Have feedback on this article? Concerned about the content? Get in touch with us directly. Alternatively, email editorial-team (at) simplywallst.com.
This article by Simply Wall St is general in nature. We provide commentary based on historical data and analyst forecasts only using an unbiased methodology and our articles are not intended to be financial advice. It does not constitute a recommendation to buy or sell any stock, and does not take account of your objectives, or your financial situation. We aim to bring you long-term focused analysis driven by fundamental data. Note that our analysis may not factor in the latest price-sensitive company announcements or qualitative material. Simply Wall St has no position in any stocks mentioned.
About SEHK:1196
Realord Group Holdings
An investment holding company, engages in the commercial printing, hangtag, motor vehicles parts, financial service, trading, property, and environmental protection businesses in Hong Kong, Mainland China, Grenada, Japan, and internationally.
Mediocre balance sheet very low.
