Great Wall Motor Company Limited's (HKG:2333) Intrinsic Value Is Potentially 68% Above Its Share Price


Key Insights
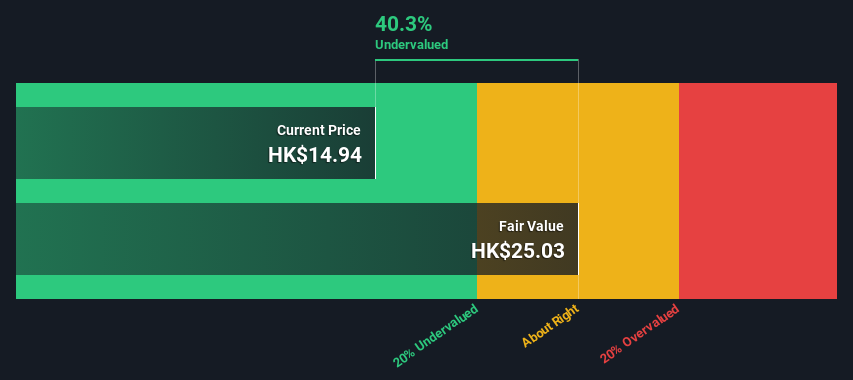
- The projected fair value for Great Wall Motor is HK$25.03 based on 2 Stage Free Cash Flow to Equity
- Current share price of HK$14.94 suggests Great Wall Motor is potentially 40% undervalued
- Our fair value estimate is 64% higher than Great Wall Motor's analyst price target of CN¥15.25
Does the October share price for Great Wall Motor Company Limited (HKG:2333) reflect what it's really worth? Today, we will estimate the stock's intrinsic value by taking the expected future cash flows and discounting them to today's value. The Discounted Cash Flow (DCF) model is the tool we will apply to do this. There's really not all that much to it, even though it might appear quite complex.
Companies can be valued in a lot of ways, so we would point out that a DCF is not perfect for every situation. Anyone interested in learning a bit more about intrinsic value should have a read of the Simply Wall St analysis model.
See our latest analysis for Great Wall Motor
Step By Step Through The Calculation
We are going to use a two-stage DCF model, which, as the name states, takes into account two stages of growth. The first stage is generally a higher growth period which levels off heading towards the terminal value, captured in the second 'steady growth' period. To start off with, we need to estimate the next ten years of cash flows. Where possible we use analyst estimates, but when these aren't available we extrapolate the previous free cash flow (FCF) from the last estimate or reported value. We assume companies with shrinking free cash flow will slow their rate of shrinkage, and that companies with growing free cash flow will see their growth rate slow, over this period. We do this to reflect that growth tends to slow more in the early years than it does in later years.
Generally we assume that a dollar today is more valuable than a dollar in the future, so we discount the value of these future cash flows to their estimated value in today's dollars:
10-year free cash flow (FCF) forecast
| 2025 | 2026 | 2027 | 2028 | 2029 | 2030 | 2031 | 2032 | 2033 | 2034 | |
| Levered FCF (CN¥, Millions) | CN¥12.7b | CN¥14.6b | CN¥16.1b | CN¥17.3b | CN¥18.3b | CN¥19.2b | CN¥20.0b | CN¥20.7b | CN¥21.3b | CN¥21.9b |
| Growth Rate Estimate Source | Analyst x3 | Analyst x3 | Est @ 9.82% | Est @ 7.55% | Est @ 5.96% | Est @ 4.85% | Est @ 4.07% | Est @ 3.52% | Est @ 3.14% | Est @ 2.87% |
| Present Value (CN¥, Millions) Discounted @ 11% | CN¥11.4k | CN¥11.9k | CN¥11.8k | CN¥11.4k | CN¥10.9k | CN¥10.3k | CN¥9.6k | CN¥9.0k | CN¥8.4k | CN¥7.8k |
("Est" = FCF growth rate estimated by Simply Wall St)
Present Value of 10-year Cash Flow (PVCF) = CN¥102b
The second stage is also known as Terminal Value, this is the business's cash flow after the first stage. For a number of reasons a very conservative growth rate is used that cannot exceed that of a country's GDP growth. In this case we have used the 5-year average of the 10-year government bond yield (2.3%) to estimate future growth. In the same way as with the 10-year 'growth' period, we discount future cash flows to today's value, using a cost of equity of 11%.
Terminal Value (TV)= FCF2034 × (1 + g) ÷ (r – g) = CN¥22b× (1 + 2.3%) ÷ (11%– 2.3%) = CN¥258b
Present Value of Terminal Value (PVTV)= TV / (1 + r)10= CN¥258b÷ ( 1 + 11%)10= CN¥91b
The total value is the sum of cash flows for the next ten years plus the discounted terminal value, which results in the Total Equity Value, which in this case is CN¥193b. To get the intrinsic value per share, we divide this by the total number of shares outstanding. Compared to the current share price of HK$14.9, the company appears quite good value at a 40% discount to where the stock price trades currently. Remember though, that this is just an approximate valuation, and like any complex formula - garbage in, garbage out.
The Assumptions
We would point out that the most important inputs to a discounted cash flow are the discount rate and of course the actual cash flows. Part of investing is coming up with your own evaluation of a company's future performance, so try the calculation yourself and check your own assumptions. The DCF also does not consider the possible cyclicality of an industry, or a company's future capital requirements, so it does not give a full picture of a company's potential performance. Given that we are looking at Great Wall Motor as potential shareholders, the cost of equity is used as the discount rate, rather than the cost of capital (or weighted average cost of capital, WACC) which accounts for debt. In this calculation we've used 11%, which is based on a levered beta of 1.749. Beta is a measure of a stock's volatility, compared to the market as a whole. We get our beta from the industry average beta of globally comparable companies, with an imposed limit between 0.8 and 2.0, which is a reasonable range for a stable business.
SWOT Analysis for Great Wall Motor
- Earnings growth over the past year exceeded the industry.
- Debt is not viewed as a risk.
- Dividends are covered by earnings and cash flows.
- Dividend is low compared to the top 25% of dividend payers in the Auto market.
- Annual revenue is forecast to grow faster than the Hong Kong market.
- Good value based on P/E ratio and estimated fair value.
- Annual earnings are forecast to grow slower than the Hong Kong market.
Moving On:
Valuation is only one side of the coin in terms of building your investment thesis, and it is only one of many factors that you need to assess for a company. It's not possible to obtain a foolproof valuation with a DCF model. Preferably you'd apply different cases and assumptions and see how they would impact the company's valuation. If a company grows at a different rate, or if its cost of equity or risk free rate changes sharply, the output can look very different. Can we work out why the company is trading at a discount to intrinsic value? For Great Wall Motor, we've put together three essential aspects you should further research:
- Risks: Take risks, for example - Great Wall Motor has 1 warning sign we think you should be aware of.
- Future Earnings: How does 2333's growth rate compare to its peers and the wider market? Dig deeper into the analyst consensus number for the upcoming years by interacting with our free analyst growth expectation chart.
- Other High Quality Alternatives: Do you like a good all-rounder? Explore our interactive list of high quality stocks to get an idea of what else is out there you may be missing!
PS. Simply Wall St updates its DCF calculation for every Hong Kong stock every day, so if you want to find the intrinsic value of any other stock just search here.
New: Manage All Your Stock Portfolios in One Place
We've created the ultimate portfolio companion for stock investors, and it's free.
• Connect an unlimited number of Portfolios and see your total in one currency
• Be alerted to new Warning Signs or Risks via email or mobile
• Track the Fair Value of your stocks
Have feedback on this article? Concerned about the content? Get in touch with us directly. Alternatively, email editorial-team (at) simplywallst.com.
This article by Simply Wall St is general in nature. We provide commentary based on historical data and analyst forecasts only using an unbiased methodology and our articles are not intended to be financial advice. It does not constitute a recommendation to buy or sell any stock, and does not take account of your objectives, or your financial situation. We aim to bring you long-term focused analysis driven by fundamental data. Note that our analysis may not factor in the latest price-sensitive company announcements or qualitative material. Simply Wall St has no position in any stocks mentioned.
About SEHK:2333
Great Wall Motor
Researches and develops, manufactures, and sells automobiles, and automotive parts and components in China, Europe, ASEAN countries, Latin America, the Middle East, Australia, South Africa, and internationally.
Undervalued with solid track record.

