- Greece
- /
- Personal Products
- /
- ATSE:SAR
Gr. Sarantis' (ATH:SAR) one-year earnings growth trails the 44% YoY shareholder returns


The simplest way to invest in stocks is to buy exchange traded funds. But one can do better than that by picking better than average stocks (as part of a diversified portfolio). To wit, the Gr. Sarantis S.A. (ATH:SAR) share price is 41% higher than it was a year ago, much better than the market return of around 11% (not including dividends) in the same period. So that should have shareholders smiling. The longer term returns have not been as good, with the stock price only 26% higher than it was three years ago.
Since the stock has added €75m to its market cap in the past week alone, let's see if underlying performance has been driving long-term returns.
See our latest analysis for Gr. Sarantis
There is no denying that markets are sometimes efficient, but prices do not always reflect underlying business performance. One way to examine how market sentiment has changed over time is to look at the interaction between a company's share price and its earnings per share (EPS).
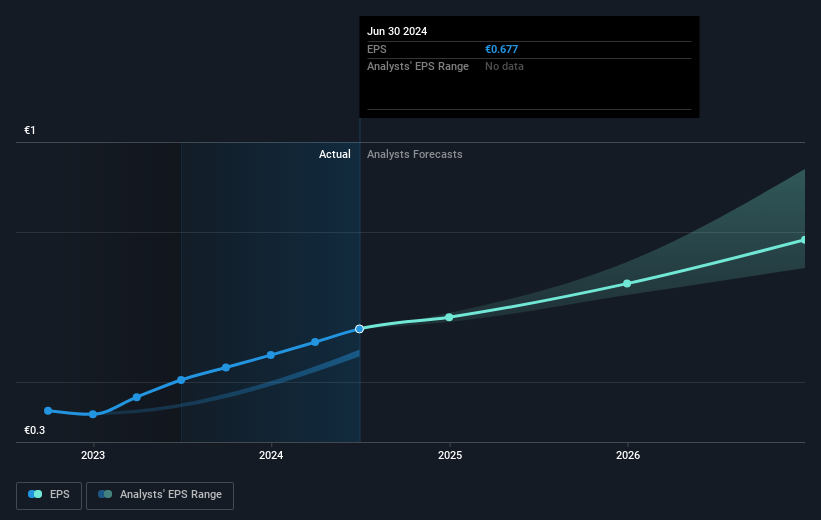
Gr. Sarantis was able to grow EPS by 34% in the last twelve months. We note that the earnings per share growth isn't far from the share price growth (of 41%). This makes us think the market hasn't really changed its sentiment around the company, in the last year. It makes intuitive sense that the share price and EPS would grow at similar rates.
The image below shows how EPS has tracked over time (if you click on the image you can see greater detail).
It's probably worth noting we've seen significant insider buying in the last quarter, which we consider a positive. That said, we think earnings and revenue growth trends are even more important factors to consider. Before buying or selling a stock, we always recommend a close examination of historic growth trends, available here..
What About Dividends?
It is important to consider the total shareholder return, as well as the share price return, for any given stock. The TSR incorporates the value of any spin-offs or discounted capital raisings, along with any dividends, based on the assumption that the dividends are reinvested. It's fair to say that the TSR gives a more complete picture for stocks that pay a dividend. We note that for Gr. Sarantis the TSR over the last 1 year was 44%, which is better than the share price return mentioned above. The dividends paid by the company have thusly boosted the total shareholder return.
A Different Perspective
It's nice to see that Gr. Sarantis shareholders have received a total shareholder return of 44% over the last year. Of course, that includes the dividend. That gain is better than the annual TSR over five years, which is 9%. Therefore it seems like sentiment around the company has been positive lately. Someone with an optimistic perspective could view the recent improvement in TSR as indicating that the business itself is getting better with time. If you want to research this stock further, the data on insider buying is an obvious place to start. You can click here to see who has been buying shares - and the price they paid.
Gr. Sarantis is not the only stock that insiders are buying. For those who like to find lesser know companies this free list of growing companies with recent insider purchasing, could be just the ticket.
Please note, the market returns quoted in this article reflect the market weighted average returns of stocks that currently trade on Greek exchanges.
New: Manage All Your Stock Portfolios in One Place
We've created the ultimate portfolio companion for stock investors, and it's free.
• Connect an unlimited number of Portfolios and see your total in one currency
• Be alerted to new Warning Signs or Risks via email or mobile
• Track the Fair Value of your stocks
Have feedback on this article? Concerned about the content? Get in touch with us directly. Alternatively, email editorial-team (at) simplywallst.com.
This article by Simply Wall St is general in nature. We provide commentary based on historical data and analyst forecasts only using an unbiased methodology and our articles are not intended to be financial advice. It does not constitute a recommendation to buy or sell any stock, and does not take account of your objectives, or your financial situation. We aim to bring you long-term focused analysis driven by fundamental data. Note that our analysis may not factor in the latest price-sensitive company announcements or qualitative material. Simply Wall St has no position in any stocks mentioned.
About ATSE:SAR
Gr. Sarantis
Produces and trades cosmetics, household, and parapharmaceutical products.
Flawless balance sheet, undervalued and pays a dividend.
