- Greece
- /
- Oil and Gas
- /
- ATSE:ELPE
HELLENiQ ENERGY Holdings' (ATH:ELPE) investors will be pleased with their 25% return over the last five years

Ideally, your overall portfolio should beat the market average. But if you pick the right individual stocks, you could make more -- or less -- than that. While the HELLENiQ ENERGY Holdings S.A. (ATH:ELPE) share price is down 17% over half a decade, the total return to shareholders (which includes dividends) was 25%. That's better than the market which declined 23% over the same time.
So let's have a look and see if the longer term performance of the company has been in line with the underlying business' progress.
See our latest analysis for HELLENiQ ENERGY Holdings
To paraphrase Benjamin Graham: Over the short term the market is a voting machine, but over the long term it's a weighing machine. One imperfect but simple way to consider how the market perception of a company has shifted is to compare the change in the earnings per share (EPS) with the share price movement.
During the unfortunate half decade during which the share price slipped, HELLENiQ ENERGY Holdings actually saw its earnings per share (EPS) improve by 37% per year. So it doesn't seem like EPS is a great guide to understanding how the market is valuing the stock. Or possibly, the market was previously very optimistic, so the stock has disappointed, despite improving EPS.
It's strange to see such muted share price performance despite sustained growth. Perhaps a clue lies in other metrics.
The steady dividend doesn't really explain why the share price is down. It's not immediately clear to us why the stock price is down but further research might provide some answers.
The image below shows how earnings and revenue have tracked over time (if you click on the image you can see greater detail).
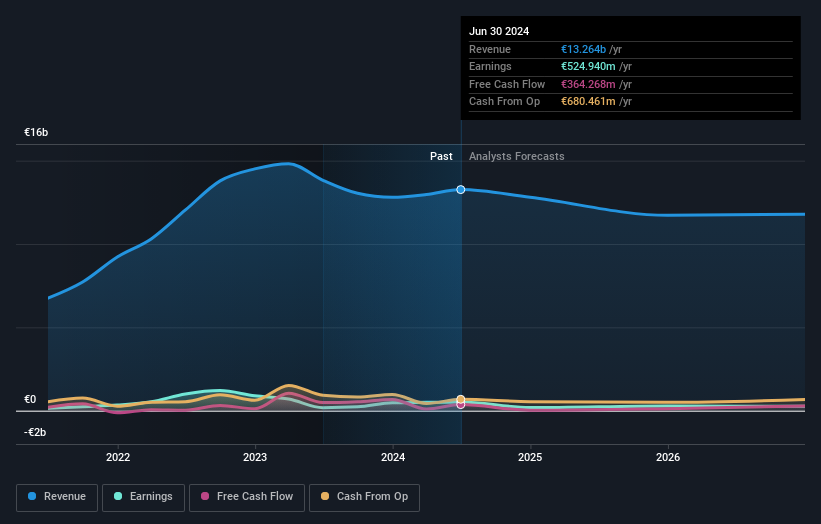
It is of course excellent to see how HELLENiQ ENERGY Holdings has grown profits over the years, but the future is more important for shareholders. Take a more thorough look at HELLENiQ ENERGY Holdings' financial health with this free report on its balance sheet.
What About Dividends?
It is important to consider the total shareholder return, as well as the share price return, for any given stock. Whereas the share price return only reflects the change in the share price, the TSR includes the value of dividends (assuming they were reinvested) and the benefit of any discounted capital raising or spin-off. It's fair to say that the TSR gives a more complete picture for stocks that pay a dividend. In the case of HELLENiQ ENERGY Holdings, it has a TSR of 25% for the last 5 years. That exceeds its share price return that we previously mentioned. The dividends paid by the company have thusly boosted the total shareholder return.
A Different Perspective
HELLENiQ ENERGY Holdings shareholders gained a total return of 15% during the year. But that return falls short of the market. On the bright side, that's still a gain, and it's actually better than the average return of 5% over half a decade It is possible that returns will improve along with the business fundamentals. It's always interesting to track share price performance over the longer term. But to understand HELLENiQ ENERGY Holdings better, we need to consider many other factors. To that end, you should learn about the 3 warning signs we've spotted with HELLENiQ ENERGY Holdings (including 1 which doesn't sit too well with us) .
If you like to buy stocks alongside management, then you might just love this free list of companies. (Hint: many of them are unnoticed AND have attractive valuation).
Please note, the market returns quoted in this article reflect the market weighted average returns of stocks that currently trade on Greek exchanges.
Valuation is complex, but we're here to simplify it.
Discover if HELLENiQ ENERGY Holdings might be undervalued or overvalued with our detailed analysis, featuring fair value estimates, potential risks, dividends, insider trades, and its financial condition.
Access Free AnalysisHave feedback on this article? Concerned about the content? Get in touch with us directly. Alternatively, email editorial-team (at) simplywallst.com.
This article by Simply Wall St is general in nature. We provide commentary based on historical data and analyst forecasts only using an unbiased methodology and our articles are not intended to be financial advice. It does not constitute a recommendation to buy or sell any stock, and does not take account of your objectives, or your financial situation. We aim to bring you long-term focused analysis driven by fundamental data. Note that our analysis may not factor in the latest price-sensitive company announcements or qualitative material. Simply Wall St has no position in any stocks mentioned.
About ATSE:ELPE
HELLENiQ ENERGY Holdings
Operates in the energy sector primarily in Greece, the Southeastern Europe, and the East Mediterranean.
Excellent balance sheet slight.

