Advertisement
- United Kingdom
- /
- IT
- /
- AIM:MTEC
Made Tech Group Plc's (LON:MTEC) Intrinsic Value Is Potentially 43% Above Its Share Price
Key Insights
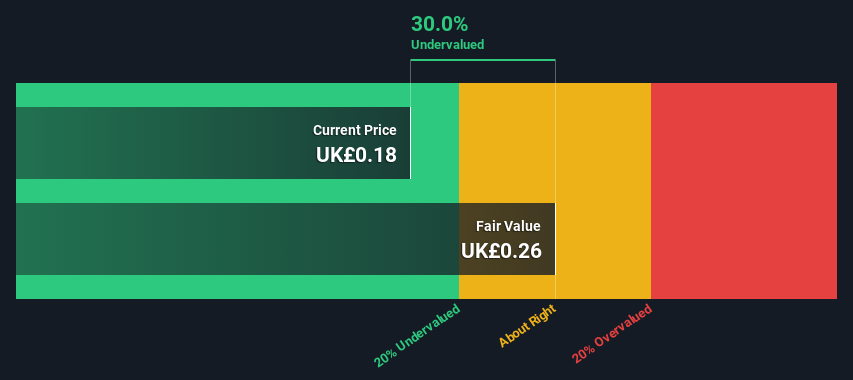
- Made Tech Group's estimated fair value is UK£0.26 based on 2 Stage Free Cash Flow to Equity
- Current share price of UK£0.18 suggests Made Tech Group is potentially 30% undervalued
In this article we are going to estimate the intrinsic value of Made Tech Group Plc (LON:MTEC) by projecting its future cash flows and then discounting them to today's value. We will use the Discounted Cash Flow (DCF) model on this occasion. Don't get put off by the jargon, the math behind it is actually quite straightforward.
Remember though, that there are many ways to estimate a company's value, and a DCF is just one method. For those who are keen learners of equity analysis, the Simply Wall St analysis model here may be something of interest to you.
View our latest analysis for Made Tech Group
Crunching The Numbers
We are going to use a two-stage DCF model, which, as the name states, takes into account two stages of growth. The first stage is generally a higher growth period which levels off heading towards the terminal value, captured in the second 'steady growth' period. To begin with, we have to get estimates of the next ten years of cash flows. Where possible we use analyst estimates, but when these aren't available we extrapolate the previous free cash flow (FCF) from the last estimate or reported value. We assume companies with shrinking free cash flow will slow their rate of shrinkage, and that companies with growing free cash flow will see their growth rate slow, over this period. We do this to reflect that growth tends to slow more in the early years than it does in later years.
Generally we assume that a dollar today is more valuable than a dollar in the future, and so the sum of these future cash flows is then discounted to today's value:
10-year free cash flow (FCF) estimate
| 2025 | 2026 | 2027 | 2028 | 2029 | 2030 | 2031 | 2032 | 2033 | 2034 | |
| Levered FCF (£, Millions) | UK£1.12m | UK£1.41m | UK£1.66m | UK£1.89m | UK£2.07m | UK£2.23m | UK£2.36m | UK£2.47m | UK£2.57m | UK£2.65m |
| Growth Rate Estimate Source | Analyst x2 | Est @ 25.23% | Est @ 18.24% | Est @ 13.35% | Est @ 9.92% | Est @ 7.52% | Est @ 5.85% | Est @ 4.67% | Est @ 3.85% | Est @ 3.27% |
| Present Value (£, Millions) Discounted @ 7.2% | UK£1.0 | UK£1.2 | UK£1.4 | UK£1.4 | UK£1.5 | UK£1.5 | UK£1.4 | UK£1.4 | UK£1.4 | UK£1.3 |
("Est" = FCF growth rate estimated by Simply Wall St)
Present Value of 10-year Cash Flow (PVCF) = UK£14m
The second stage is also known as Terminal Value, this is the business's cash flow after the first stage. The Gordon Growth formula is used to calculate Terminal Value at a future annual growth rate equal to the 5-year average of the 10-year government bond yield of 1.9%. We discount the terminal cash flows to today's value at a cost of equity of 7.2%.
Terminal Value (TV)= FCF2034 × (1 + g) ÷ (r – g) = UK£2.6m× (1 + 1.9%) ÷ (7.2%– 1.9%) = UK£51m
Present Value of Terminal Value (PVTV)= TV / (1 + r)10= UK£51m÷ ( 1 + 7.2%)10= UK£25m
The total value, or equity value, is then the sum of the present value of the future cash flows, which in this case is UK£39m. The last step is to then divide the equity value by the number of shares outstanding. Compared to the current share price of UK£0.2, the company appears quite undervalued at a 30% discount to where the stock price trades currently. The assumptions in any calculation have a big impact on the valuation, so it is better to view this as a rough estimate, not precise down to the last cent.
The Assumptions
The calculation above is very dependent on two assumptions. The first is the discount rate and the other is the cash flows. Part of investing is coming up with your own evaluation of a company's future performance, so try the calculation yourself and check your own assumptions. The DCF also does not consider the possible cyclicality of an industry, or a company's future capital requirements, so it does not give a full picture of a company's potential performance. Given that we are looking at Made Tech Group as potential shareholders, the cost of equity is used as the discount rate, rather than the cost of capital (or weighted average cost of capital, WACC) which accounts for debt. In this calculation we've used 7.2%, which is based on a levered beta of 1.092. Beta is a measure of a stock's volatility, compared to the market as a whole. We get our beta from the industry average beta of globally comparable companies, with an imposed limit between 0.8 and 2.0, which is a reasonable range for a stable business.
Moving On:
Although the valuation of a company is important, it shouldn't be the only metric you look at when researching a company. The DCF model is not a perfect stock valuation tool. Instead the best use for a DCF model is to test certain assumptions and theories to see if they would lead to the company being undervalued or overvalued. For instance, if the terminal value growth rate is adjusted slightly, it can dramatically alter the overall result. Can we work out why the company is trading at a discount to intrinsic value? For Made Tech Group, we've put together three relevant items you should consider:
- Risks: Be aware that Made Tech Group is showing 2 warning signs in our investment analysis , and 1 of those makes us a bit uncomfortable...
- Future Earnings: How does MTEC's growth rate compare to its peers and the wider market? Dig deeper into the analyst consensus number for the upcoming years by interacting with our free analyst growth expectation chart.
- Other High Quality Alternatives: Do you like a good all-rounder? Explore our interactive list of high quality stocks to get an idea of what else is out there you may be missing!
PS. Simply Wall St updates its DCF calculation for every British stock every day, so if you want to find the intrinsic value of any other stock just search here.
New: Manage All Your Stock Portfolios in One Place
We've created the ultimate portfolio companion for stock investors, and it's free.
• Connect an unlimited number of Portfolios and see your total in one currency
• Be alerted to new Warning Signs or Risks via email or mobile
• Track the Fair Value of your stocks
Have feedback on this article? Concerned about the content? Get in touch with us directly. Alternatively, email editorial-team (at) simplywallst.com.
This article by Simply Wall St is general in nature. We provide commentary based on historical data and analyst forecasts only using an unbiased methodology and our articles are not intended to be financial advice. It does not constitute a recommendation to buy or sell any stock, and does not take account of your objectives, or your financial situation. We aim to bring you long-term focused analysis driven by fundamental data. Note that our analysis may not factor in the latest price-sensitive company announcements or qualitative material. Simply Wall St has no position in any stocks mentioned.
About AIM:MTEC
Made Tech Group
Through its subsidiaries, engages in the provision of digital, data, and technology services to the public sector in the United Kingdom.
Flawless balance sheet with reasonable growth potential.
Market Insights


Advertisement
Weekly Picks
LO


Lou_Basenese on Giftify ·
Giftify ($GIFT): A Small-Cap Incentives Platform with More ScaleThan Its Valuation Suggests
Fair Value:US$2.562.2% undervalued
36 followersusers have followed this narrative
1 commentusers have commented on this narrative
8 likesusers have liked this narrative
HA


HarishPK on lululemon athletica ·
Quantifying the Transition: Why Lululemon’s Moat Remains Intact
Fair Value:US$161.828.9% undervalued
10 followersusers have followed this narrative
0 commentsusers have commented on this narrative
8 likesusers have liked this narrative
TR


tripledub on Alphabet ·
Warren Buffett Just Bet $10 Billion on Google. The Catch? You May Already Be Too Late.
Fair Value:US$23059.6% overvalued
41 followersusers have followed this narrative
1 commentusers have commented on this narrative
10 likesusers have liked this narrative
JO


John_Eric on Veeva Systems ·
AI-Powered Veeva Systems Poised for Solid Growth Amid Regulatory Stability
Fair Value:US$32039.9% undervalued
14 followersusers have followed this narrative
0 commentsusers have commented on this narrative
0 likesusers have liked this narrative
Recently Updated Narratives
DA


davidlsander on Nevgold ·
The U.S. Government Is Desperate for This Metal. This Tiny Miner Has It -- Its Closest Peer Is Already Worth Double.
Fair Value:US$2.1929.2% undervalued
1 followerusers have followed this narrative
0 commentsusers have commented on this narrative
0 likesusers have liked this narrative
GE

Germaine on Kucingko Berhad ·
Kucingko Berhad: Fundamentals Show Early Recovery as Creative Content Expansion Gains Traction
Fair Value:RM 0.012733.3% overvalued
1 followerusers have followed this narrative
0 commentsusers have commented on this narrative
0 likesusers have liked this narrative
BL


Blagget on BP Silver ·
“valer un Potosí” GOOGLE IT. Now you’re should be kinda locked in. Educate yourself, Read the rest.
Fair Value:CA$685.7% undervalued
1 followerusers have followed this narrative
0 commentsusers have commented on this narrative
0 likesusers have liked this narrative
Popular Narratives
IN


Investingwilly on Mastercard ·
Mastercard: The Best Dividend Stock You're Ignoring
Fair Value:US$75029.1% undervalued
84 followersusers have followed this narrative
1 commentusers have commented on this narrative
9 likesusers have liked this narrative
HA

HarishPK on Adobe ·
Adobe: A Probabilistic Case for Undervaluation
Fair Value:US$319.9630.8% undervalued
64 followersusers have followed this narrative
9 commentsusers have commented on this narrative
19 likesusers have liked this narrative
BL


BlackGoat on Cerebras Systems ·
The Wafer Giant Threatening NVIDIA's GPU Hegemony
Fair Value:US$415.5457.5% undervalued
59 followersusers have followed this narrative
3 commentsusers have commented on this narrative
10 likesusers have liked this narrative
Trending Discussion


AN

andre_k1tsg on Companhia de Saneamento de Minas Gerais ·
Eu André José Julião digo o caminho da melhorar a toda população esta entrando no trilhos.
0
|0