Is NEXT plc's (LON:NXT) Recent Stock Performance Tethered To Its Strong Fundamentals?

NEXT's (LON:NXT) stock is up by a considerable 21% over the past three months. Given the company's impressive performance, we decided to study its financial indicators more closely as a company's financial health over the long-term usually dictates market outcomes. Specifically, we decided to study NEXT's ROE in this article.
ROE or return on equity is a useful tool to assess how effectively a company can generate returns on the investment it received from its shareholders. Simply put, it is used to assess the profitability of a company in relation to its equity capital.
Check out our latest analysis for NEXT
How Do You Calculate Return On Equity?
The formula for ROE is:
Return on Equity = Net Profit (from continuing operations) ÷ Shareholders' Equity
So, based on the above formula, the ROE for NEXT is:
63% = UK£701m ÷ UK£1.1b (Based on the trailing twelve months to July 2023).
The 'return' is the profit over the last twelve months. Another way to think of that is that for every £1 worth of equity, the company was able to earn £0.63 in profit.
What Is The Relationship Between ROE And Earnings Growth?
Thus far, we have learned that ROE measures how efficiently a company is generating its profits. We now need to evaluate how much profit the company reinvests or "retains" for future growth which then gives us an idea about the growth potential of the company. Assuming everything else remains unchanged, the higher the ROE and profit retention, the higher the growth rate of a company compared to companies that don't necessarily bear these characteristics.
NEXT's Earnings Growth And 63% ROE
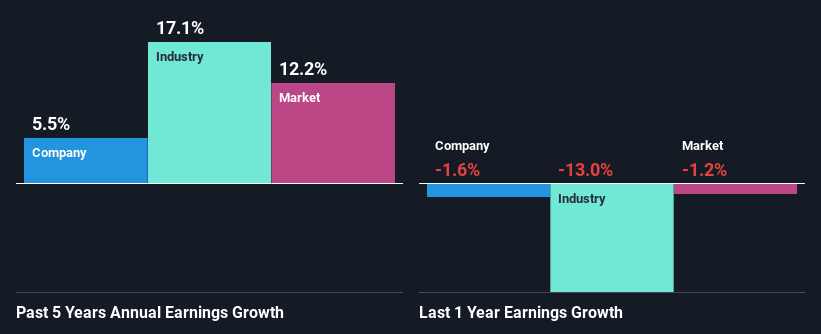
First thing first, we like that NEXT has an impressive ROE. Second, a comparison with the average ROE reported by the industry of 16% also doesn't go unnoticed by us. This likely paved the way for the modest 5.5% net income growth seen by NEXT over the past five years.
We then compared NEXT's net income growth with the industry and found that the company's growth figure is lower than the average industry growth rate of 17% in the same 5-year period, which is a bit concerning.
Earnings growth is an important metric to consider when valuing a stock. The investor should try to establish if the expected growth or decline in earnings, whichever the case may be, is priced in. Doing so will help them establish if the stock's future looks promising or ominous. If you're wondering about NEXT's's valuation, check out this gauge of its price-to-earnings ratio, as compared to its industry.
Is NEXT Efficiently Re-investing Its Profits?
NEXT has a healthy combination of a moderate three-year median payout ratio of 35% (or a retention ratio of 65%) and a respectable amount of growth in earnings as we saw above, meaning that the company has been making efficient use of its profits.
Moreover, NEXT is determined to keep sharing its profits with shareholders which we infer from its long history of paying a dividend for at least ten years. Our latest analyst data shows that the future payout ratio of the company over the next three years is expected to be approximately 37%. However, NEXT's future ROE is expected to decline to 41% despite there being not much change anticipated in the company's payout ratio.
Summary
In total, we are pretty happy with NEXT's performance. Specifically, we like that the company is reinvesting a huge chunk of its profits at a high rate of return. This of course has caused the company to see a good amount of growth in its earnings. Having said that, the company's earnings growth is expected to slow down, as forecasted in the current analyst estimates. Are these analysts expectations based on the broad expectations for the industry, or on the company's fundamentals? Click here to be taken to our analyst's forecasts page for the company.
Mobile Infrastructure for Defense and Disaster
The next wave in robotics isn't humanoid. Its fully autonomous towers delivering 5G, ISR, and radar in under 30 minutes, anywhere.
Get the investor briefing before the next round of contracts
Sponsored On Behalf of CiTechValuation is complex, but we're here to simplify it.
Discover if NEXT might be undervalued or overvalued with our detailed analysis, featuring fair value estimates, potential risks, dividends, insider trades, and its financial condition.
Access Free AnalysisHave feedback on this article? Concerned about the content? Get in touch with us directly. Alternatively, email editorial-team (at) simplywallst.com.
This article by Simply Wall St is general in nature. We provide commentary based on historical data and analyst forecasts only using an unbiased methodology and our articles are not intended to be financial advice. It does not constitute a recommendation to buy or sell any stock, and does not take account of your objectives, or your financial situation. We aim to bring you long-term focused analysis driven by fundamental data. Note that our analysis may not factor in the latest price-sensitive company announcements or qualitative material. Simply Wall St has no position in any stocks mentioned.
About LSE:NXT
NEXT
Engages in the retail of clothing, homeware, and beauty products in the United Kingdom, rest of Europe, the Middle East, Asia, and internationally.
Flawless balance sheet with moderate growth potential.
Similar Companies
Market Insights

Weekly Picks

THE KINGDOM OF BROWN GOODS: WHY MGPI IS BEING CRUSHED BY INVENTORY & PRIMED FOR RESURRECTION


Why Vertical Aerospace (NYSE: EVTL) is Worth Possibly Over 13x its Current Price


The Quiet Giant That Became AI’s Power Grid
Recently Updated Narratives


MINISO's fair value is projected at 26.69 with an anticipated PE ratio shift of 20x

Fiverr International will transform the freelance industry with AI-powered growth

Jackson Financial Stock: When Insurance Math Meets a Shifting Claims Landscape
Popular Narratives


MicroVision will explode future revenue by 380.37% with a vision towards success


Crazy Undervalued 42 Baggers Silver Play (Active & Running Mine)


