
Advertisement
Howard Marks put it nicely when he said that, rather than worrying about share price volatility, 'The possibility of permanent loss is the risk I worry about... and every practical investor I know worries about.' When we think about how risky a company is, we always like to look at its use of debt, since debt overload can lead to ruin. We can see that Frasers Group Plc (LON:FRAS) does use debt in its business. But the real question is whether this debt is making the company risky.
What Risk Does Debt Bring?
Debt is a tool to help businesses grow, but if a business is incapable of paying off its lenders, then it exists at their mercy. Part and parcel of capitalism is the process of 'creative destruction' where failed businesses are mercilessly liquidated by their bankers. While that is not too common, we often do see indebted companies permanently diluting shareholders because lenders force them to raise capital at a distressed price. Of course, plenty of companies use debt to fund growth, without any negative consequences. The first step when considering a company's debt levels is to consider its cash and debt together.
View our latest analysis for Frasers Group
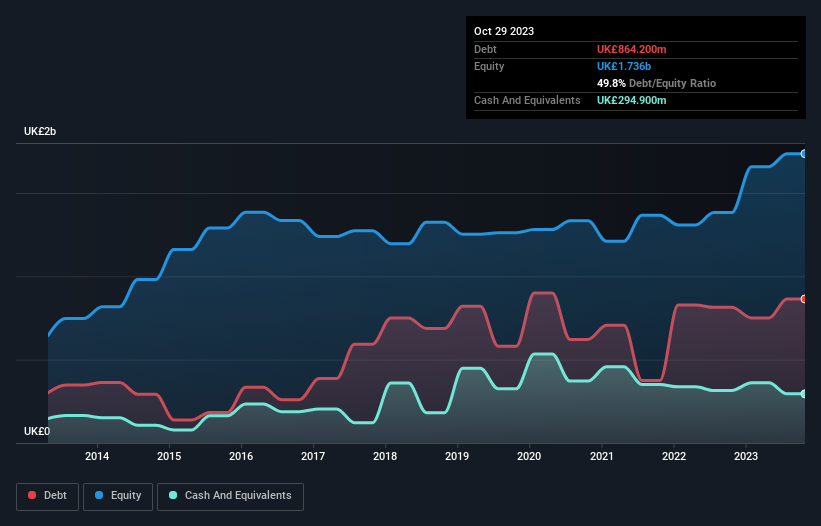
What Is Frasers Group's Net Debt?
You can click the graphic below for the historical numbers, but it shows that as of October 2023 Frasers Group had UK£864.2m of debt, an increase on UK£813.9m, over one year. On the flip side, it has UK£294.9m in cash leading to net debt of about UK£569.3m.
How Healthy Is Frasers Group's Balance Sheet?
We can see from the most recent balance sheet that Frasers Group had liabilities of UK£1.26b falling due within a year, and liabilities of UK£1.65b due beyond that. Offsetting this, it had UK£294.9m in cash and UK£443.0m in receivables that were due within 12 months. So it has liabilities totalling UK£2.17b more than its cash and near-term receivables, combined.
This is a mountain of leverage relative to its market capitalization of UK£3.53b. Should its lenders demand that it shore up the balance sheet, shareholders would likely face severe dilution.
We use two main ratios to inform us about debt levels relative to earnings. The first is net debt divided by earnings before interest, tax, depreciation, and amortization (EBITDA), while the second is how many times its earnings before interest and tax (EBIT) covers its interest expense (or its interest cover, for short). The advantage of this approach is that we take into account both the absolute quantum of debt (with net debt to EBITDA) and the actual interest expenses associated with that debt (with its interest cover ratio).
Frasers Group has net debt of just 0.81 times EBITDA, suggesting it could ramp leverage without breaking a sweat. And remarkably, despite having net debt, it actually received more in interest over the last twelve months than it had to pay. So it's fair to say it can handle debt like a hotshot teppanyaki chef handles cooking. Fortunately, Frasers Group grew its EBIT by 3.5% in the last year, making that debt load look even more manageable. The balance sheet is clearly the area to focus on when you are analysing debt. But it is future earnings, more than anything, that will determine Frasers Group's ability to maintain a healthy balance sheet going forward. So if you're focused on the future you can check out this free report showing analyst profit forecasts.
Finally, a business needs free cash flow to pay off debt; accounting profits just don't cut it. So we clearly need to look at whether that EBIT is leading to corresponding free cash flow. During the last three years, Frasers Group produced sturdy free cash flow equating to 52% of its EBIT, about what we'd expect. This free cash flow puts the company in a good position to pay down debt, when appropriate.
Our View
On our analysis Frasers Group's interest cover should signal that it won't have too much trouble with its debt. However, our other observations weren't so heartening. For instance it seems like it has to struggle a bit to handle its total liabilities. When we consider all the elements mentioned above, it seems to us that Frasers Group is managing its debt quite well. But a word of caution: we think debt levels are high enough to justify ongoing monitoring. There's no doubt that we learn most about debt from the balance sheet. But ultimately, every company can contain risks that exist outside of the balance sheet. Be aware that Frasers Group is showing 3 warning signs in our investment analysis , and 1 of those is potentially serious...
When all is said and done, sometimes its easier to focus on companies that don't even need debt. Readers can access a list of growth stocks with zero net debt 100% free, right now.
New: AI Stock Screener & Alerts
Our new AI Stock Screener scans the market every day to uncover opportunities.
• Dividend Powerhouses (3%+ Yield)
• Undervalued Small Caps with Insider Buying
• High growth Tech and AI Companies
Or build your own from over 50 metrics.
Have feedback on this article? Concerned about the content? Get in touch with us directly. Alternatively, email editorial-team (at) simplywallst.com.
This article by Simply Wall St is general in nature. We provide commentary based on historical data and analyst forecasts only using an unbiased methodology and our articles are not intended to be financial advice. It does not constitute a recommendation to buy or sell any stock, and does not take account of your objectives, or your financial situation. We aim to bring you long-term focused analysis driven by fundamental data. Note that our analysis may not factor in the latest price-sensitive company announcements or qualitative material. Simply Wall St has no position in any stocks mentioned.
About LSE:FRAS
Frasers Group
Engages in the retail and wholesale of sports and leisure clothing, footwear and equipment, and apparel through department stores, shops, and online.
Excellent balance sheet and fair value.
Similar Companies
Market Insights

Advertisement
Community Narratives
Kodiak AI - a potential 100 bagger opportunity?
Fair Value US$14.00|44.7% undervalued
DA
Community Contributor
A Fair Price for a Great Business Facing Real Threats
Fair Value US$383.06|13.0% undervalued
IM
Community Contributor
AXON And Shopify Integration Will Unlock Global Mobile Advertising
Fair Value US$646.30|0% overvalued
AN
Based on Analyst Price Targets