- United Kingdom
- /
- Specialty Stores
- /
- AIM:BWNG
N Brown Group plc's (LON:BWNG) 33% Share Price Surge Not Quite Adding Up


N Brown Group plc (LON:BWNG) shareholders would be excited to see that the share price has had a great month, posting a 33% gain and recovering from prior weakness. Unfortunately, the gains of the last month did little to right the losses of the last year with the stock still down 20% over that time.
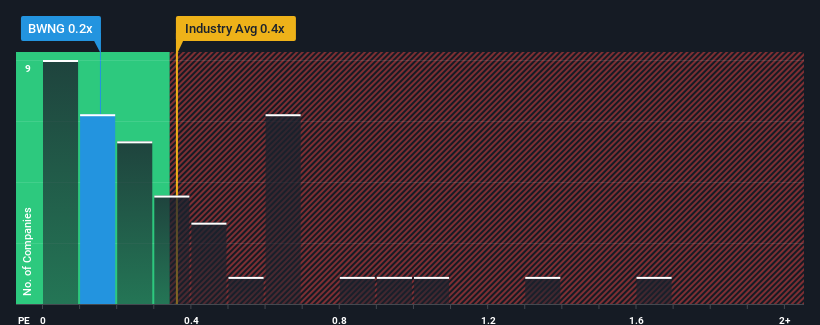
In spite of the firm bounce in price, there still wouldn't be many who think N Brown Group's price-to-sales (or "P/S") ratio of 0.2x is worth a mention when the median P/S in the United Kingdom's Specialty Retail industry is similar at about 0.4x. However, investors might be overlooking a clear opportunity or potential setback if there is no rational basis for the P/S.
Check out our latest analysis for N Brown Group
How N Brown Group Has Been Performing
For example, consider that N Brown Group's financial performance has been poor lately as its revenue has been in decline. It might be that many expect the company to put the disappointing revenue performance behind them over the coming period, which has kept the P/S from falling. If not, then existing shareholders may be a little nervous about the viability of the share price.
Although there are no analyst estimates available for N Brown Group, take a look at this free data-rich visualisation to see how the company stacks up on earnings, revenue and cash flow.How Is N Brown Group's Revenue Growth Trending?
There's an inherent assumption that a company should be matching the industry for P/S ratios like N Brown Group's to be considered reasonable.
Taking a look back first, the company's revenue growth last year wasn't something to get excited about as it posted a disappointing decline of 11%. As a result, revenue from three years ago have also fallen 18% overall. Accordingly, shareholders would have felt downbeat about the medium-term rates of revenue growth.
In contrast to the company, the rest of the industry is expected to grow by 3.6% over the next year, which really puts the company's recent medium-term revenue decline into perspective.
With this information, we find it concerning that N Brown Group is trading at a fairly similar P/S compared to the industry. Apparently many investors in the company are way less bearish than recent times would indicate and aren't willing to let go of their stock right now. There's a good chance existing shareholders are setting themselves up for future disappointment if the P/S falls to levels more in line with the recent negative growth rates.
The Final Word
N Brown Group's stock has a lot of momentum behind it lately, which has brought its P/S level with the rest of the industry. Typically, we'd caution against reading too much into price-to-sales ratios when settling on investment decisions, though it can reveal plenty about what other market participants think about the company.
The fact that N Brown Group currently trades at a P/S on par with the rest of the industry is surprising to us since its recent revenues have been in decline over the medium-term, all while the industry is set to grow. When we see revenue heading backwards in the context of growing industry forecasts, it'd make sense to expect a possible share price decline on the horizon, sending the moderate P/S lower. If recent medium-term revenue trends continue, it will place shareholders' investments at risk and potential investors in danger of paying an unnecessary premium.
You need to take note of risks, for example - N Brown Group has 3 warning signs (and 1 which can't be ignored) we think you should know about.
If you're unsure about the strength of N Brown Group's business, why not explore our interactive list of stocks with solid business fundamentals for some other companies you may have missed.
If you're looking to trade N Brown Group, open an account with the lowest-cost platform trusted by professionals, Interactive Brokers.
With clients in over 200 countries and territories, and access to 160 markets, IBKR lets you trade stocks, options, futures, forex, bonds and funds from a single integrated account.
Enjoy no hidden fees, no account minimums, and FX conversion rates as low as 0.03%, far better than what most brokers offer.
Sponsored ContentValuation is complex, but we're here to simplify it.
Discover if N Brown Group might be undervalued or overvalued with our detailed analysis, featuring fair value estimates, potential risks, dividends, insider trades, and its financial condition.
Access Free AnalysisHave feedback on this article? Concerned about the content? Get in touch with us directly. Alternatively, email editorial-team (at) simplywallst.com.
This article by Simply Wall St is general in nature. We provide commentary based on historical data and analyst forecasts only using an unbiased methodology and our articles are not intended to be financial advice. It does not constitute a recommendation to buy or sell any stock, and does not take account of your objectives, or your financial situation. We aim to bring you long-term focused analysis driven by fundamental data. Note that our analysis may not factor in the latest price-sensitive company announcements or qualitative material. Simply Wall St has no position in any stocks mentioned.
About AIM:BWNG
N Brown Group
Operates as a clothing and footwear digital retailer in the United Kingdom.
Adequate balance sheet and slightly overvalued.
Similar Companies
Market Insights

Community Narratives

