- United Kingdom
- /
- Specialty Stores
- /
- AIM:BWNG
Capital Allocation Trends At N Brown Group (LON:BWNG) Aren't Ideal


What financial metrics can indicate to us that a company is maturing or even in decline? More often than not, we'll see a declining return on capital employed (ROCE) and a declining amount of capital employed. Trends like this ultimately mean the business is reducing its investments and also earning less on what it has invested. In light of that, from a first glance at N Brown Group (LON:BWNG), we've spotted some signs that it could be struggling, so let's investigate.
What Is Return On Capital Employed (ROCE)?
For those who don't know, ROCE is a measure of a company's yearly pre-tax profit (its return), relative to the capital employed in the business. To calculate this metric for N Brown Group, this is the formula:
Return on Capital Employed = Earnings Before Interest and Tax (EBIT) ÷ (Total Assets - Current Liabilities)
0.0093 = UK£7.2m ÷ (UK£909m - UK£132m) (Based on the trailing twelve months to August 2022).
Thus, N Brown Group has an ROCE of 0.9%. In absolute terms, that's a low return and it also under-performs the Online Retail industry average of 7.1%.
Check out our latest analysis for N Brown Group
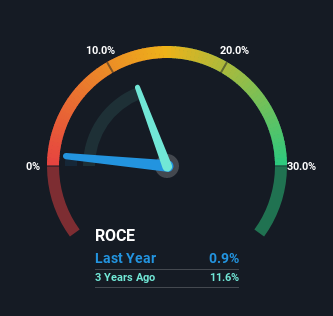
Above you can see how the current ROCE for N Brown Group compares to its prior returns on capital, but there's only so much you can tell from the past. If you're interested, you can view the analysts predictions in our free report on analyst forecasts for the company.
The Trend Of ROCE
We are a bit worried about the trend of returns on capital at N Brown Group. To be more specific, the ROCE was 11% five years ago, but since then it has dropped noticeably. On top of that, it's worth noting that the amount of capital employed within the business has remained relatively steady. This combination can be indicative of a mature business that still has areas to deploy capital, but the returns received aren't as high due potentially to new competition or smaller margins. If these trends continue, we wouldn't expect N Brown Group to turn into a multi-bagger.
The Bottom Line On N Brown Group's ROCE
In the end, the trend of lower returns on the same amount of capital isn't typically an indication that we're looking at a growth stock. This could explain why the stock has sunk a total of 90% in the last five years. That being the case, unless the underlying trends revert to a more positive trajectory, we'd consider looking elsewhere.
On a final note, we found 2 warning signs for N Brown Group (1 doesn't sit too well with us) you should be aware of.
While N Brown Group isn't earning the highest return, check out this free list of companies that are earning high returns on equity with solid balance sheets.
If you're looking to trade N Brown Group, open an account with the lowest-cost platform trusted by professionals, Interactive Brokers.
With clients in over 200 countries and territories, and access to 160 markets, IBKR lets you trade stocks, options, futures, forex, bonds and funds from a single integrated account.
Enjoy no hidden fees, no account minimums, and FX conversion rates as low as 0.03%, far better than what most brokers offer.
Sponsored ContentValuation is complex, but we're here to simplify it.
Discover if N Brown Group might be undervalued or overvalued with our detailed analysis, featuring fair value estimates, potential risks, dividends, insider trades, and its financial condition.
Access Free AnalysisHave feedback on this article? Concerned about the content? Get in touch with us directly. Alternatively, email editorial-team (at) simplywallst.com.
This article by Simply Wall St is general in nature. We provide commentary based on historical data and analyst forecasts only using an unbiased methodology and our articles are not intended to be financial advice. It does not constitute a recommendation to buy or sell any stock, and does not take account of your objectives, or your financial situation. We aim to bring you long-term focused analysis driven by fundamental data. Note that our analysis may not factor in the latest price-sensitive company announcements or qualitative material. Simply Wall St has no position in any stocks mentioned.
About AIM:BWNG
N Brown Group
Operates as a clothing and footwear digital retailer in the United Kingdom.
Adequate balance sheet and slightly overvalued.
Similar Companies
Market Insights

Community Narratives

