- United Kingdom
- /
- Pharma
- /
- LSE:HIK
Here's Why Hikma Pharmaceuticals (LON:HIK) Can Manage Its Debt Responsibly


The external fund manager backed by Berkshire Hathaway's Charlie Munger, Li Lu, makes no bones about it when he says 'The biggest investment risk is not the volatility of prices, but whether you will suffer a permanent loss of capital.' So it might be obvious that you need to consider debt, when you think about how risky any given stock is, because too much debt can sink a company. We can see that Hikma Pharmaceuticals PLC (LON:HIK) does use debt in its business. But the more important question is: how much risk is that debt creating?
Why Does Debt Bring Risk?
Debt and other liabilities become risky for a business when it cannot easily fulfill those obligations, either with free cash flow or by raising capital at an attractive price. If things get really bad, the lenders can take control of the business. While that is not too common, we often do see indebted companies permanently diluting shareholders because lenders force them to raise capital at a distressed price. Having said that, the most common situation is where a company manages its debt reasonably well - and to its own advantage. When we think about a company's use of debt, we first look at cash and debt together.
See our latest analysis for Hikma Pharmaceuticals
What Is Hikma Pharmaceuticals's Debt?
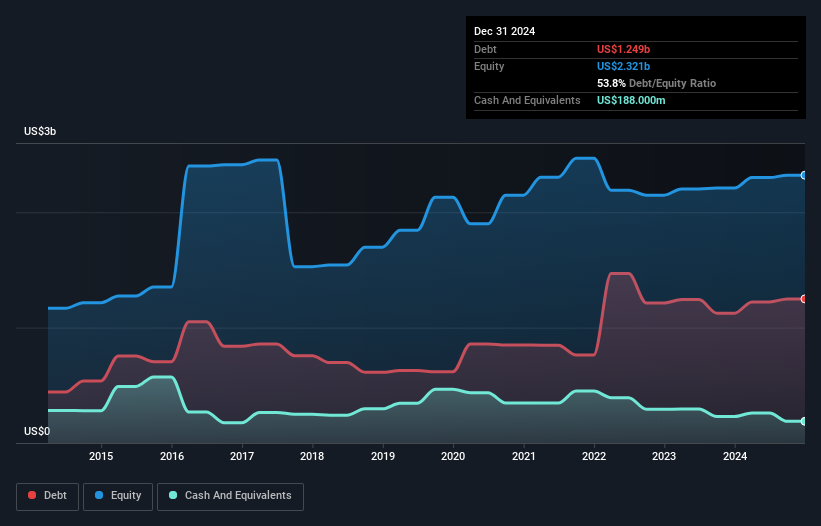
You can click the graphic below for the historical numbers, but it shows that as of December 2024 Hikma Pharmaceuticals had US$1.25b of debt, an increase on US$1.13b, over one year. On the flip side, it has US$188.0m in cash leading to net debt of about US$1.06b.
How Healthy Is Hikma Pharmaceuticals' Balance Sheet?
Zooming in on the latest balance sheet data, we can see that Hikma Pharmaceuticals had liabilities of US$1.98b due within 12 months and liabilities of US$834.0m due beyond that. Offsetting these obligations, it had cash of US$188.0m as well as receivables valued at US$973.0m due within 12 months. So its liabilities total US$1.65b more than the combination of its cash and short-term receivables.
This deficit isn't so bad because Hikma Pharmaceuticals is worth US$5.77b, and thus could probably raise enough capital to shore up its balance sheet, if the need arose. But it's clear that we should definitely closely examine whether it can manage its debt without dilution.
We measure a company's debt load relative to its earnings power by looking at its net debt divided by its earnings before interest, tax, depreciation, and amortization (EBITDA) and by calculating how easily its earnings before interest and tax (EBIT) cover its interest expense (interest cover). The advantage of this approach is that we take into account both the absolute quantum of debt (with net debt to EBITDA) and the actual interest expenses associated with that debt (with its interest cover ratio).
Looking at its net debt to EBITDA of 1.4 and interest cover of 7.0 times, it seems to us that Hikma Pharmaceuticals is probably using debt in a pretty reasonable way. But the interest payments are certainly sufficient to have us thinking about how affordable its debt is. On the other hand, Hikma Pharmaceuticals saw its EBIT drop by 4.0% in the last twelve months. If earnings continue to decline at that rate the company may have increasing difficulty managing its debt load. When analysing debt levels, the balance sheet is the obvious place to start. But ultimately the future profitability of the business will decide if Hikma Pharmaceuticals can strengthen its balance sheet over time. So if you want to see what the professionals think, you might find this free report on analyst profit forecasts to be interesting.
Finally, a company can only pay off debt with cold hard cash, not accounting profits. So we always check how much of that EBIT is translated into free cash flow. During the last three years, Hikma Pharmaceuticals produced sturdy free cash flow equating to 61% of its EBIT, about what we'd expect. This free cash flow puts the company in a good position to pay down debt, when appropriate.
Our View
Hikma Pharmaceuticals's conversion of EBIT to free cash flow was a real positive on this analysis, as was its net debt to EBITDA. On the other hand, its EBIT growth rate makes us a little less comfortable about its debt. Considering this range of data points, we think Hikma Pharmaceuticals is in a good position to manage its debt levels. But a word of caution: we think debt levels are high enough to justify ongoing monitoring. When analysing debt levels, the balance sheet is the obvious place to start. But ultimately, every company can contain risks that exist outside of the balance sheet. Case in point: We've spotted 1 warning sign for Hikma Pharmaceuticals you should be aware of.
If, after all that, you're more interested in a fast growing company with a rock-solid balance sheet, then check out our list of net cash growth stocks without delay.
If you're looking to trade Hikma Pharmaceuticals, open an account with the lowest-cost platform trusted by professionals, Interactive Brokers.
With clients in over 200 countries and territories, and access to 160 markets, IBKR lets you trade stocks, options, futures, forex, bonds and funds from a single integrated account.
Enjoy no hidden fees, no account minimums, and FX conversion rates as low as 0.03%, far better than what most brokers offer.
Sponsored ContentValuation is complex, but we're here to simplify it.
Discover if Hikma Pharmaceuticals might be undervalued or overvalued with our detailed analysis, featuring fair value estimates, potential risks, dividends, insider trades, and its financial condition.
Access Free AnalysisHave feedback on this article? Concerned about the content? Get in touch with us directly. Alternatively, email editorial-team (at) simplywallst.com.
This article by Simply Wall St is general in nature. We provide commentary based on historical data and analyst forecasts only using an unbiased methodology and our articles are not intended to be financial advice. It does not constitute a recommendation to buy or sell any stock, and does not take account of your objectives, or your financial situation. We aim to bring you long-term focused analysis driven by fundamental data. Note that our analysis may not factor in the latest price-sensitive company announcements or qualitative material. Simply Wall St has no position in any stocks mentioned.
About LSE:HIK
Hikma Pharmaceuticals
Develops, manufactures, markets, and sells a range of generic, branded, and in-licensed pharmaceutical products.
Undervalued established dividend payer.
Similar Companies
Market Insights

Community Narratives


