

Key Insights
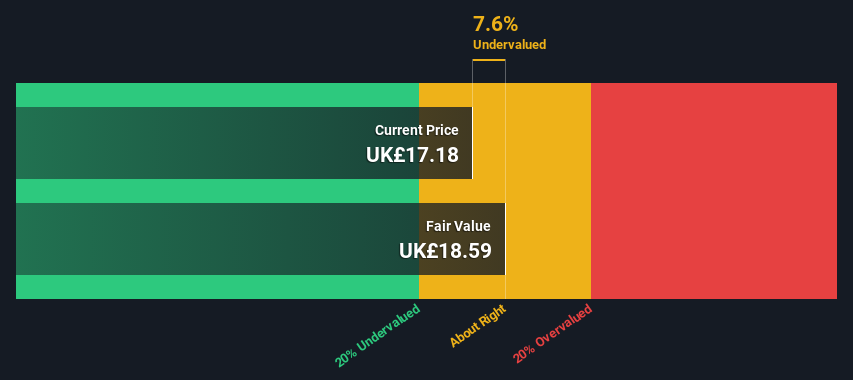
- Genus' estimated fair value is UK£18.59 based on 2 Stage Free Cash Flow to Equity
- Genus' UK£17.18 share price indicates it is trading at similar levels as its fair value estimate
- Analyst price target for GNS is UK£29.62, which is 59% above our fair value estimate
Today we will run through one way of estimating the intrinsic value of Genus plc (LON:GNS) by taking the expected future cash flows and discounting them to today's value. One way to achieve this is by employing the Discounted Cash Flow (DCF) model. It may sound complicated, but actually it is quite simple!
We generally believe that a company's value is the present value of all of the cash it will generate in the future. However, a DCF is just one valuation metric among many, and it is not without flaws. If you still have some burning questions about this type of valuation, take a look at the Simply Wall St analysis model.
View our latest analysis for Genus
The Method
We use what is known as a 2-stage model, which simply means we have two different periods of growth rates for the company's cash flows. Generally the first stage is higher growth, and the second stage is a lower growth phase. In the first stage we need to estimate the cash flows to the business over the next ten years. Where possible we use analyst estimates, but when these aren't available we extrapolate the previous free cash flow (FCF) from the last estimate or reported value. We assume companies with shrinking free cash flow will slow their rate of shrinkage, and that companies with growing free cash flow will see their growth rate slow, over this period. We do this to reflect that growth tends to slow more in the early years than it does in later years.
Generally we assume that a dollar today is more valuable than a dollar in the future, so we need to discount the sum of these future cash flows to arrive at a present value estimate:
10-year free cash flow (FCF) estimate
| 2024 | 2025 | 2026 | 2027 | 2028 | 2029 | 2030 | 2031 | 2032 | 2033 | |
| Levered FCF (£, Millions) | UK£20.3m | UK£55.8m | UK£59.6m | UK£66.0m | UK£68.0m | UK£69.6m | UK£71.2m | UK£72.6m | UK£74.0m | UK£75.3m |
| Growth Rate Estimate Source | Analyst x3 | Analyst x4 | Analyst x3 | Analyst x1 | Analyst x1 | Est @ 2.41% | Est @ 2.18% | Est @ 2.02% | Est @ 1.90% | Est @ 1.82% |
| Present Value (£, Millions) Discounted @ 6.7% | UK£19.1 | UK£49.0 | UK£49.0 | UK£50.9 | UK£49.1 | UK£47.1 | UK£45.1 | UK£43.1 | UK£41.2 | UK£39.3 |
("Est" = FCF growth rate estimated by Simply Wall St)
Present Value of 10-year Cash Flow (PVCF) = UK£433m
The second stage is also known as Terminal Value, this is the business's cash flow after the first stage. For a number of reasons a very conservative growth rate is used that cannot exceed that of a country's GDP growth. In this case we have used the 5-year average of the 10-year government bond yield (1.6%) to estimate future growth. In the same way as with the 10-year 'growth' period, we discount future cash flows to today's value, using a cost of equity of 6.7%.
Terminal Value (TV)= FCF2033 × (1 + g) ÷ (r – g) = UK£75m× (1 + 1.6%) ÷ (6.7%– 1.6%) = UK£1.5b
Present Value of Terminal Value (PVTV)= TV / (1 + r)10= UK£1.5b÷ ( 1 + 6.7%)10= UK£786m
The total value, or equity value, is then the sum of the present value of the future cash flows, which in this case is UK£1.2b. The last step is to then divide the equity value by the number of shares outstanding. Compared to the current share price of UK£17.2, the company appears about fair value at a 7.6% discount to where the stock price trades currently. Valuations are imprecise instruments though, rather like a telescope - move a few degrees and end up in a different galaxy. Do keep this in mind.
The Assumptions
Now the most important inputs to a discounted cash flow are the discount rate, and of course, the actual cash flows. Part of investing is coming up with your own evaluation of a company's future performance, so try the calculation yourself and check your own assumptions. The DCF also does not consider the possible cyclicality of an industry, or a company's future capital requirements, so it does not give a full picture of a company's potential performance. Given that we are looking at Genus as potential shareholders, the cost of equity is used as the discount rate, rather than the cost of capital (or weighted average cost of capital, WACC) which accounts for debt. In this calculation we've used 6.7%, which is based on a levered beta of 0.928. Beta is a measure of a stock's volatility, compared to the market as a whole. We get our beta from the industry average beta of globally comparable companies, with an imposed limit between 0.8 and 2.0, which is a reasonable range for a stable business.
SWOT Analysis for Genus
- Net debt to equity ratio below 40%.
- Earnings declined over the past year.
- Interest payments on debt are not well covered.
- Dividend is low compared to the top 25% of dividend payers in the Biotechs market.
- Annual earnings are forecast to grow faster than the British market.
- Current share price is below our estimate of fair value.
- Debt is not well covered by operating cash flow.
- Dividends are not covered by cash flow.
- Revenue is forecast to grow slower than 20% per year.
Next Steps:
Whilst important, the DCF calculation is only one of many factors that you need to assess for a company. DCF models are not the be-all and end-all of investment valuation. Instead the best use for a DCF model is to test certain assumptions and theories to see if they would lead to the company being undervalued or overvalued. If a company grows at a different rate, or if its cost of equity or risk free rate changes sharply, the output can look very different. For Genus, we've compiled three essential elements you should explore:
- Financial Health: Does GNS have a healthy balance sheet? Take a look at our free balance sheet analysis with six simple checks on key factors like leverage and risk.
- Future Earnings: How does GNS's growth rate compare to its peers and the wider market? Dig deeper into the analyst consensus number for the upcoming years by interacting with our free analyst growth expectation chart.
- Other Solid Businesses: Low debt, high returns on equity and good past performance are fundamental to a strong business. Why not explore our interactive list of stocks with solid business fundamentals to see if there are other companies you may not have considered!
PS. The Simply Wall St app conducts a discounted cash flow valuation for every stock on the LSE every day. If you want to find the calculation for other stocks just search here.
New: Manage All Your Stock Portfolios in One Place
We've created the ultimate portfolio companion for stock investors, and it's free.
• Connect an unlimited number of Portfolios and see your total in one currency
• Be alerted to new Warning Signs or Risks via email or mobile
• Track the Fair Value of your stocks
Have feedback on this article? Concerned about the content? Get in touch with us directly. Alternatively, email editorial-team (at) simplywallst.com.
This article by Simply Wall St is general in nature. We provide commentary based on historical data and analyst forecasts only using an unbiased methodology and our articles are not intended to be financial advice. It does not constitute a recommendation to buy or sell any stock, and does not take account of your objectives, or your financial situation. We aim to bring you long-term focused analysis driven by fundamental data. Note that our analysis may not factor in the latest price-sensitive company announcements or qualitative material. Simply Wall St has no position in any stocks mentioned.
About LSE:GNS
Genus
Operates as an animal genetics company in North America, Latin America, the United Kingdom, rest of Europe, the Middle East, Russia, Africa, and Asia.
Good value with reasonable growth potential.
Market Insights

Community Narratives


