

Some say volatility, rather than debt, is the best way to think about risk as an investor, but Warren Buffett famously said that 'Volatility is far from synonymous with risk.' It's only natural to consider a company's balance sheet when you examine how risky it is, since debt is often involved when a business collapses. We can see that Redx Pharma Plc (LON:REDX) does use debt in its business. But is this debt a concern to shareholders?
What Risk Does Debt Bring?
Generally speaking, debt only becomes a real problem when a company can't easily pay it off, either by raising capital or with its own cash flow. If things get really bad, the lenders can take control of the business. However, a more usual (but still expensive) situation is where a company must dilute shareholders at a cheap share price simply to get debt under control. Of course, plenty of companies use debt to fund growth, without any negative consequences. The first step when considering a company's debt levels is to consider its cash and debt together.
View our latest analysis for Redx Pharma
What Is Redx Pharma's Net Debt?
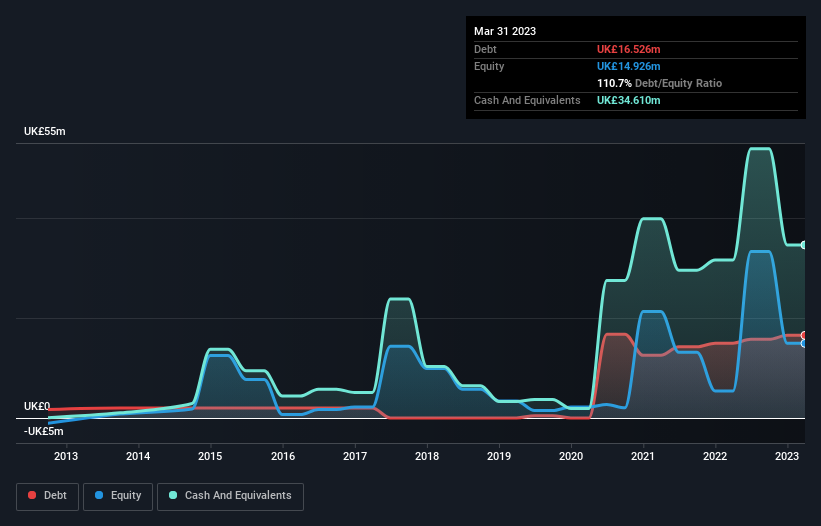
The image below, which you can click on for greater detail, shows that at March 2023 Redx Pharma had debt of UK£16.5m, up from UK£15.0m in one year. But it also has UK£34.6m in cash to offset that, meaning it has UK£18.1m net cash.
A Look At Redx Pharma's Liabilities
According to the last reported balance sheet, Redx Pharma had liabilities of UK£26.3m due within 12 months, and liabilities of UK£1.62m due beyond 12 months. Offsetting these obligations, it had cash of UK£34.6m as well as receivables valued at UK£796.0k due within 12 months. So it actually has UK£7.48m more liquid assets than total liabilities.
This short term liquidity is a sign that Redx Pharma could probably pay off its debt with ease, as its balance sheet is far from stretched. Simply put, the fact that Redx Pharma has more cash than debt is arguably a good indication that it can manage its debt safely. When analysing debt levels, the balance sheet is the obvious place to start. But ultimately the future profitability of the business will decide if Redx Pharma can strengthen its balance sheet over time. So if you're focused on the future you can check out this free report showing analyst profit forecasts.
Over 12 months, Redx Pharma made a loss at the EBIT level, and saw its revenue drop to UK£13m, which is a fall of 22%. That makes us nervous, to say the least.
So How Risky Is Redx Pharma?
Statistically speaking companies that lose money are riskier than those that make money. And we do note that Redx Pharma had an earnings before interest and tax (EBIT) loss, over the last year. Indeed, in that time it burnt through UK£30m of cash and made a loss of UK£29m. With only UK£18.1m on the balance sheet, it would appear that its going to need to raise capital again soon. Overall, its balance sheet doesn't seem overly risky, at the moment, but we're always cautious until we see the positive free cash flow. There's no doubt that we learn most about debt from the balance sheet. However, not all investment risk resides within the balance sheet - far from it. To that end, you should learn about the 3 warning signs we've spotted with Redx Pharma (including 2 which are a bit concerning) .
If, after all that, you're more interested in a fast growing company with a rock-solid balance sheet, then check out our list of net cash growth stocks without delay.
New: AI Stock Screener & Alerts
Our new AI Stock Screener scans the market every day to uncover opportunities.
• Dividend Powerhouses (3%+ Yield)
• Undervalued Small Caps with Insider Buying
• High growth Tech and AI Companies
Or build your own from over 50 metrics.
Have feedback on this article? Concerned about the content? Get in touch with us directly. Alternatively, email editorial-team (at) simplywallst.com.
This article by Simply Wall St is general in nature. We provide commentary based on historical data and analyst forecasts only using an unbiased methodology and our articles are not intended to be financial advice. It does not constitute a recommendation to buy or sell any stock, and does not take account of your objectives, or your financial situation. We aim to bring you long-term focused analysis driven by fundamental data. Note that our analysis may not factor in the latest price-sensitive company announcements or qualitative material. Simply Wall St has no position in any stocks mentioned.
About AIM:REDX
Redx Pharma
Engages in drug discovery, pre-clinical development, and licensing activities in the United Kingdom.
Excellent balance sheet with weak fundamentals.
Market Insights

Community Narratives
