- United Kingdom
- /
- Media
- /
- LSE:INF
Informa plc's (LON:INF) Intrinsic Value Is Potentially 72% Above Its Share Price


Key Insights
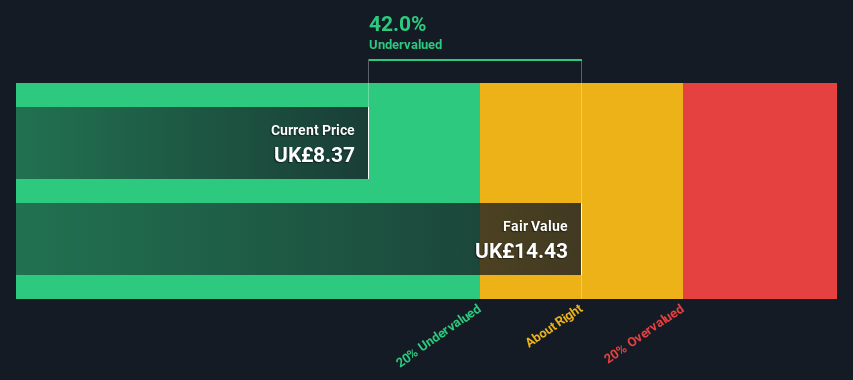
- The projected fair value for Informa is UK£14.43 based on 2 Stage Free Cash Flow to Equity
- Informa's UK£8.37 share price signals that it might be 42% undervalued
- Our fair value estimate is 50% higher than Informa's analyst price target of UK£9.64
Today we'll do a simple run through of a valuation method used to estimate the attractiveness of Informa plc (LON:INF) as an investment opportunity by projecting its future cash flows and then discounting them to today's value. The Discounted Cash Flow (DCF) model is the tool we will apply to do this. It may sound complicated, but actually it is quite simple!
Remember though, that there are many ways to estimate a company's value, and a DCF is just one method. If you still have some burning questions about this type of valuation, take a look at the Simply Wall St analysis model.
See our latest analysis for Informa
What's The Estimated Valuation?
We use what is known as a 2-stage model, which simply means we have two different periods of growth rates for the company's cash flows. Generally the first stage is higher growth, and the second stage is a lower growth phase. To start off with, we need to estimate the next ten years of cash flows. Where possible we use analyst estimates, but when these aren't available we extrapolate the previous free cash flow (FCF) from the last estimate or reported value. We assume companies with shrinking free cash flow will slow their rate of shrinkage, and that companies with growing free cash flow will see their growth rate slow, over this period. We do this to reflect that growth tends to slow more in the early years than it does in later years.
A DCF is all about the idea that a dollar in the future is less valuable than a dollar today, so we need to discount the sum of these future cash flows to arrive at a present value estimate:
10-year free cash flow (FCF) forecast
| 2024 | 2025 | 2026 | 2027 | 2028 | 2029 | 2030 | 2031 | 2032 | 2033 | |
| Levered FCF (£, Millions) | UK£724.1m | UK£844.5m | UK£925.4m | UK£984.8m | UK£1.03b | UK£1.08b | UK£1.11b | UK£1.14b | UK£1.17b | UK£1.20b |
| Growth Rate Estimate Source | Analyst x6 | Analyst x6 | Analyst x4 | Est @ 6.42% | Est @ 5.03% | Est @ 4.05% | Est @ 3.37% | Est @ 2.89% | Est @ 2.55% | Est @ 2.32% |
| Present Value (£, Millions) Discounted @ 6.8% | UK£678 | UK£740 | UK£759 | UK£756 | UK£743 | UK£724 | UK£700 | UK£675 | UK£648 | UK£620 |
("Est" = FCF growth rate estimated by Simply Wall St)
Present Value of 10-year Cash Flow (PVCF) = UK£7.0b
After calculating the present value of future cash flows in the initial 10-year period, we need to calculate the Terminal Value, which accounts for all future cash flows beyond the first stage. For a number of reasons a very conservative growth rate is used that cannot exceed that of a country's GDP growth. In this case we have used the 5-year average of the 10-year government bond yield (1.8%) to estimate future growth. In the same way as with the 10-year 'growth' period, we discount future cash flows to today's value, using a cost of equity of 6.8%.
Terminal Value (TV)= FCF2033 × (1 + g) ÷ (r – g) = UK£1.2b× (1 + 1.8%) ÷ (6.8%– 1.8%) = UK£24b
Present Value of Terminal Value (PVTV)= TV / (1 + r)10= UK£24b÷ ( 1 + 6.8%)10= UK£12b
The total value, or equity value, is then the sum of the present value of the future cash flows, which in this case is UK£20b. In the final step we divide the equity value by the number of shares outstanding. Relative to the current share price of UK£8.4, the company appears quite undervalued at a 42% discount to where the stock price trades currently. The assumptions in any calculation have a big impact on the valuation, so it is better to view this as a rough estimate, not precise down to the last cent.
Important Assumptions
Now the most important inputs to a discounted cash flow are the discount rate, and of course, the actual cash flows. Part of investing is coming up with your own evaluation of a company's future performance, so try the calculation yourself and check your own assumptions. The DCF also does not consider the possible cyclicality of an industry, or a company's future capital requirements, so it does not give a full picture of a company's potential performance. Given that we are looking at Informa as potential shareholders, the cost of equity is used as the discount rate, rather than the cost of capital (or weighted average cost of capital, WACC) which accounts for debt. In this calculation we've used 6.8%, which is based on a levered beta of 0.923. Beta is a measure of a stock's volatility, compared to the market as a whole. We get our beta from the industry average beta of globally comparable companies, with an imposed limit between 0.8 and 2.0, which is a reasonable range for a stable business.
SWOT Analysis for Informa
- Earnings growth over the past year exceeded the industry.
- Debt is not viewed as a risk.
- Dividends are covered by earnings and cash flows.
- Dividend is low compared to the top 25% of dividend payers in the Media market.
- Annual revenue is forecast to grow faster than the British market.
- Good value based on P/E ratio and estimated fair value.
- Annual earnings are forecast to grow slower than the British market.
Next Steps:
Valuation is only one side of the coin in terms of building your investment thesis, and it ideally won't be the sole piece of analysis you scrutinize for a company. DCF models are not the be-all and end-all of investment valuation. Preferably you'd apply different cases and assumptions and see how they would impact the company's valuation. For instance, if the terminal value growth rate is adjusted slightly, it can dramatically alter the overall result. What is the reason for the share price sitting below the intrinsic value? For Informa, we've put together three relevant elements you should explore:
- Risks: For example, we've discovered 1 warning sign for Informa that you should be aware of before investing here.
- Future Earnings: How does INF's growth rate compare to its peers and the wider market? Dig deeper into the analyst consensus number for the upcoming years by interacting with our free analyst growth expectation chart.
- Other High Quality Alternatives: Do you like a good all-rounder? Explore our interactive list of high quality stocks to get an idea of what else is out there you may be missing!
PS. The Simply Wall St app conducts a discounted cash flow valuation for every stock on the LSE every day. If you want to find the calculation for other stocks just search here.
New: AI Stock Screener & Alerts
Our new AI Stock Screener scans the market every day to uncover opportunities.
• Dividend Powerhouses (3%+ Yield)
• Undervalued Small Caps with Insider Buying
• High growth Tech and AI Companies
Or build your own from over 50 metrics.
Have feedback on this article? Concerned about the content? Get in touch with us directly. Alternatively, email editorial-team (at) simplywallst.com.
This article by Simply Wall St is general in nature. We provide commentary based on historical data and analyst forecasts only using an unbiased methodology and our articles are not intended to be financial advice. It does not constitute a recommendation to buy or sell any stock, and does not take account of your objectives, or your financial situation. We aim to bring you long-term focused analysis driven by fundamental data. Note that our analysis may not factor in the latest price-sensitive company announcements or qualitative material. Simply Wall St has no position in any stocks mentioned.
About LSE:INF
Informa
Operates as an international events, digital services, and academic research company in the United Kingdom, Continental Europe, the United States, China, and internationally.
Reasonable growth potential with adequate balance sheet.
Similar Companies
Market Insights

Community Narratives


