
Advertisement
- United Kingdom
- /
- Media
- /
- LSE:CAU
Centaur Media Plc (LON:CAU) Shares Could Be 49% Below Their Intrinsic Value Estimate

Key Insights
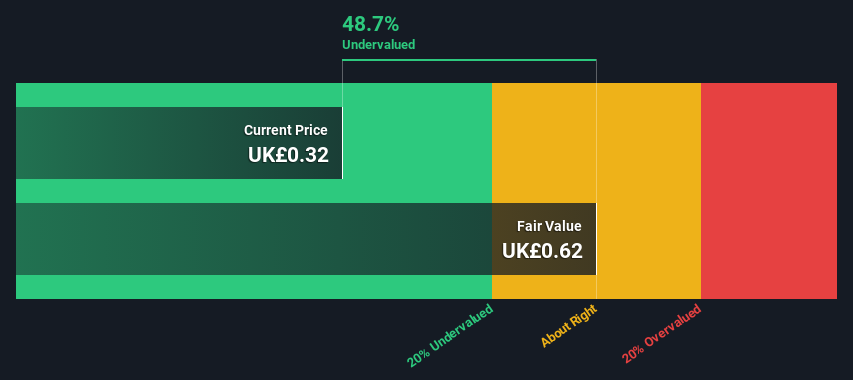
- The projected fair value for Centaur Media is UK£0.62 based on 2 Stage Free Cash Flow to Equity
- Centaur Media's UK£0.32 share price signals that it might be 49% undervalued
- Centaur Media's peers seem to be trading at a lower discount to fair value based onthe industry average of 43%
Does the July share price for Centaur Media Plc (LON:CAU) reflect what it's really worth? Today, we will estimate the stock's intrinsic value by taking the forecast future cash flows of the company and discounting them back to today's value. Our analysis will employ the Discounted Cash Flow (DCF) model. There's really not all that much to it, even though it might appear quite complex.
Remember though, that there are many ways to estimate a company's value, and a DCF is just one method. For those who are keen learners of equity analysis, the Simply Wall St analysis model here may be something of interest to you.
View our latest analysis for Centaur Media
Is Centaur Media Fairly Valued?
We are going to use a two-stage DCF model, which, as the name states, takes into account two stages of growth. The first stage is generally a higher growth period which levels off heading towards the terminal value, captured in the second 'steady growth' period. In the first stage we need to estimate the cash flows to the business over the next ten years. Where possible we use analyst estimates, but when these aren't available we extrapolate the previous free cash flow (FCF) from the last estimate or reported value. We assume companies with shrinking free cash flow will slow their rate of shrinkage, and that companies with growing free cash flow will see their growth rate slow, over this period. We do this to reflect that growth tends to slow more in the early years than it does in later years.
A DCF is all about the idea that a dollar in the future is less valuable than a dollar today, and so the sum of these future cash flows is then discounted to today's value:
10-year free cash flow (FCF) forecast
| 2025 | 2026 | 2027 | 2028 | 2029 | 2030 | 2031 | 2032 | 2033 | 2034 | |
| Levered FCF (£, Millions) | UK£4.30m | UK£4.40m | UK£4.49m | UK£4.58m | UK£4.66m | UK£4.75m | UK£4.84m | UK£4.92m | UK£5.01m | UK£5.10m |
| Growth Rate Estimate Source | Analyst x1 | Analyst x1 | Est @ 2.01% | Est @ 1.94% | Est @ 1.89% | Est @ 1.85% | Est @ 1.83% | Est @ 1.81% | Est @ 1.80% | Est @ 1.79% |
| Present Value (£, Millions) Discounted @ 6.6% | UK£4.0 | UK£3.9 | UK£3.7 | UK£3.5 | UK£3.4 | UK£3.2 | UK£3.1 | UK£3.0 | UK£2.8 | UK£2.7 |
("Est" = FCF growth rate estimated by Simply Wall St)
Present Value of 10-year Cash Flow (PVCF) = UK£33m
After calculating the present value of future cash flows in the initial 10-year period, we need to calculate the Terminal Value, which accounts for all future cash flows beyond the first stage. The Gordon Growth formula is used to calculate Terminal Value at a future annual growth rate equal to the 5-year average of the 10-year government bond yield of 1.8%. We discount the terminal cash flows to today's value at a cost of equity of 6.6%.
Terminal Value (TV)= FCF2034 × (1 + g) ÷ (r – g) = UK£5.1m× (1 + 1.8%) ÷ (6.6%– 1.8%) = UK£108m
Present Value of Terminal Value (PVTV)= TV / (1 + r)10= UK£108m÷ ( 1 + 6.6%)10= UK£57m
The total value is the sum of cash flows for the next ten years plus the discounted terminal value, which results in the Total Equity Value, which in this case is UK£90m. To get the intrinsic value per share, we divide this by the total number of shares outstanding. Compared to the current share price of UK£0.3, the company appears quite good value at a 49% discount to where the stock price trades currently. Valuations are imprecise instruments though, rather like a telescope - move a few degrees and end up in a different galaxy. Do keep this in mind.
The Assumptions
Now the most important inputs to a discounted cash flow are the discount rate, and of course, the actual cash flows. Part of investing is coming up with your own evaluation of a company's future performance, so try the calculation yourself and check your own assumptions. The DCF also does not consider the possible cyclicality of an industry, or a company's future capital requirements, so it does not give a full picture of a company's potential performance. Given that we are looking at Centaur Media as potential shareholders, the cost of equity is used as the discount rate, rather than the cost of capital (or weighted average cost of capital, WACC) which accounts for debt. In this calculation we've used 6.6%, which is based on a levered beta of 0.878. Beta is a measure of a stock's volatility, compared to the market as a whole. We get our beta from the industry average beta of globally comparable companies, with an imposed limit between 0.8 and 2.0, which is a reasonable range for a stable business.
SWOT Analysis for Centaur Media
Strength
- Earnings growth over the past year exceeded the industry.
- Currently debt free.
- Dividend is in the top 25% of dividend payers in the market.
Weakness
- No major weaknesses identified for CAU.
Opportunity
- Annual revenue is forecast to grow faster than the British market.
- Good value based on P/E ratio and estimated fair value.
Threat
- Dividends are not covered by cash flow.
Looking Ahead:
Although the valuation of a company is important, it is only one of many factors that you need to assess for a company. It's not possible to obtain a foolproof valuation with a DCF model. Rather it should be seen as a guide to "what assumptions need to be true for this stock to be under/overvalued?" For instance, if the terminal value growth rate is adjusted slightly, it can dramatically alter the overall result. Can we work out why the company is trading at a discount to intrinsic value? For Centaur Media, we've put together three pertinent items you should explore:
- Risks: For instance, we've identified 4 warning signs for Centaur Media (1 makes us a bit uncomfortable) you should be aware of.
- Future Earnings: How does CAU's growth rate compare to its peers and the wider market? Dig deeper into the analyst consensus number for the upcoming years by interacting with our free analyst growth expectation chart.
- Other High Quality Alternatives: Do you like a good all-rounder? Explore our interactive list of high quality stocks to get an idea of what else is out there you may be missing!
PS. The Simply Wall St app conducts a discounted cash flow valuation for every stock on the LSE every day. If you want to find the calculation for other stocks just search here.
New: AI Stock Screener & Alerts
Our new AI Stock Screener scans the market every day to uncover opportunities.
• Dividend Powerhouses (3%+ Yield)
• Undervalued Small Caps with Insider Buying
• High growth Tech and AI Companies
Or build your own from over 50 metrics.
Have feedback on this article? Concerned about the content? Get in touch with us directly. Alternatively, email editorial-team (at) simplywallst.com.
This article by Simply Wall St is general in nature. We provide commentary based on historical data and analyst forecasts only using an unbiased methodology and our articles are not intended to be financial advice. It does not constitute a recommendation to buy or sell any stock, and does not take account of your objectives, or your financial situation. We aim to bring you long-term focused analysis driven by fundamental data. Note that our analysis may not factor in the latest price-sensitive company announcements or qualitative material. Simply Wall St has no position in any stocks mentioned.
Have feedback on this article? Concerned about the content? Get in touch with us directly. Alternatively, email editorial-team@simplywallst.com
About LSE:CAU
Centaur Media
Engages in the provision of business information, learning, and specialist consultancy to professional and commercial markets in the United Kingdom, rest of Europe, North America, and internationally.
Excellent balance sheet with reasonable growth potential.
Market Insights

Advertisement
Community Narratives
Pinterest will surge as advertising innovations ignite revenue growth
Fair Value US$42.63|27.0% undervalued
BR
Community Contributor
Brambles' Revenue Set to Climb 14% with Profit Margins Following
Fair Value AU$21.90|5.9% overvalued
RO
Community Contributor
Challenging Future for STG as Organic Sales Decline by 8.8%
Fair Value DKK 116.13|26.8% undervalued
KA
Community Contributor